Virtual Water Flows – Conclusions and Impacts
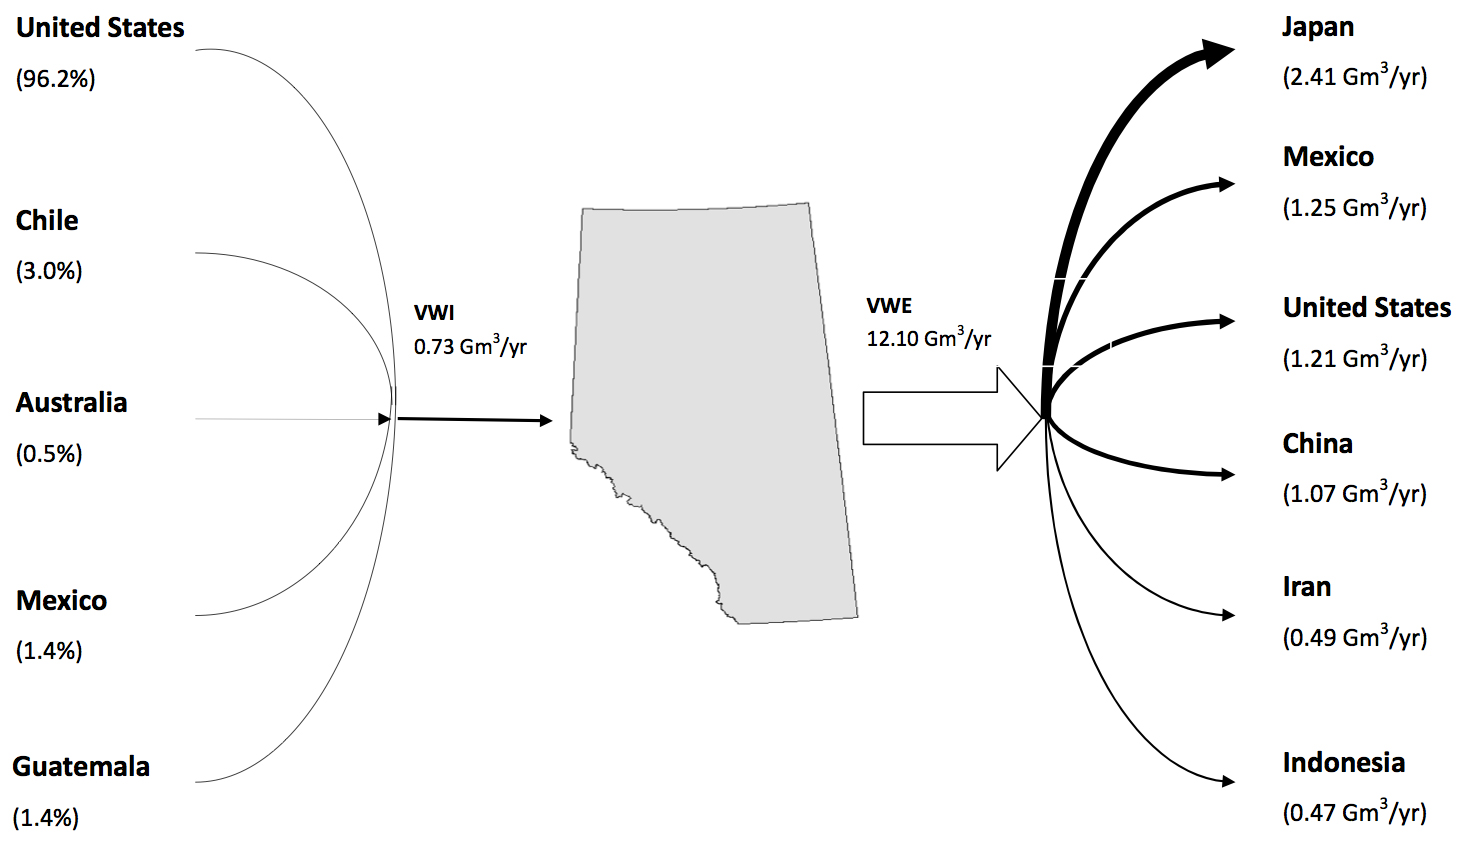
The average volume of annual virtual water exports from Alberta was 12.10 Gm3/year (during the period 1999-2008).
The largest importers of virtual water from Alberta were:
- Japan (2.4 Gm3/year)
- Mexico (1.25 Gm3/year)
- USA (1.2 Gm3/year)
- China (1.1 Gm3/year)
- Iran (0.5 Gm3/year)
- Indonesia (0.5 Gm3/year)
…and those countries accounted for 57% of the total virtual water exports from Alberta. Alberta had virtual water exports to almost all countries in the world, particularly those in East and South and Southeast Asia, Middle East and North Africa, and many countries in South America.
In contrast, the average annual virtual water imports into Alberta was only 0.73 Gm3/year (during 1999-2008), and the USA alone accounted for over 96% of the total virtual water imports into Alberta.
Virtual water losses were calculated as the difference between virtual water exported from Alberta and virtual water imported from the importing counries. Virtual water import was estimated by multiplying the import volumes by the Water Footprint of the importing commodities of the importing countries (for this estimation, it was assumed that the importing commodities were produced domestically in the importing countries). In the calculation, wheat was not planted in Indonesia. In this case, the global average water footprint of wheat was used.
For the top six virtual water importers from Alberta, virtual water losses occurred in all countries except Iran. This means that, at a global level, the trading of crops from Alberta did not help improve water use efficiency. On the contrary, the trading of crops resulted in lower water use efficiency. For example, the virtual water exports from Alberta to Japan was 2.41 Gm3/year. However, if Japan produced the traded crops, it would only need 1.06 Gm3/year. This resulted in a virtual water loss of 1.35 Gm3/year. The reason for this lower efficiency is due to the higher water productivity in importing countries than Alberta. For example, the Water Footprint of wheat in Alberta was 1,635 m3/ton, but it was only 734 m3/ton in Japan.
The general the high Water Footprint in Alberta is generally due to two reasons:
- Rainfed agriculture is dominant in Alberta
- Precipitation is low
Due to low precipitation levels and the dominance of rainfed-based agriculture, the crop yield of crops was generally low and water use efficiency was low, resulting in a relatively high water footprint. Iran was the only country with virtual water gain from the trade. Iran had a generally higher Water Footprint than Alberta, or lower water use efficiency.
Read more about the Conditions and Limitations of this study.

