Water Footprint
People use lots of water for drinking, cooking and washing, but even more for producing things such as food, paper, cotton clothes, etc. The water footprint is an indicator of water use that looks at both direct and indirect water use of a consumer or producer. The water footprint of an individual, community or business is defined as the total volume of freshwater that is used to produce the goods and services consumed by the individual or community or produced by the business.
Some of the most comprehensive and innovative research on better understanding the concepts of a water footprint and the movement of virtual water is being done by the Water Footprint Network, a non-profit foundation under Dutch law. In addition, the Alberta Water Research Institute is also supporting an initiative to better understand the ‘virtual water’ content of economic activities in Alberta – as an example, the water embodied in agricultural goods for export internationally and domestically will be defined.
There has been little attention to the fact that, in the end, the organisation and characteristics of our global production and supply chain does actually strongly influence the volumes (and temporal and spatial distribution) of water consumption and pollution that can be associated with a final consumer product. Research has shown that visualizing the hidden water use behind products can help in understanding the global character of fresh water and in quantifying the effects of consumption and trade on water resources use. This improved understanding can form a basis for a better management of the globe’s freshwater resources.
The concept of virtual water is closely related to water footprints; the ability to grasp virtual water flow depends on how much is known and understood about the total amount of freshwater used in the production of commodities and services. Take chocolate, for example, which requires about 2400 litres per 100 grams. Industrial water footprints vary greatly from country to country. In the United States, it takes about 100 litres of freshwater to produce each US$1 of product. In Germany and the Netherlands, it takes about half that amount (50 litres). In Japan, Australia, and Canada, industries use between 10 to 15 litres of freshwater per US$1 of product. These statistics do not depend solely on a nation’s willingness to make business water-efficient, but also on the industries in which the nation is involved.
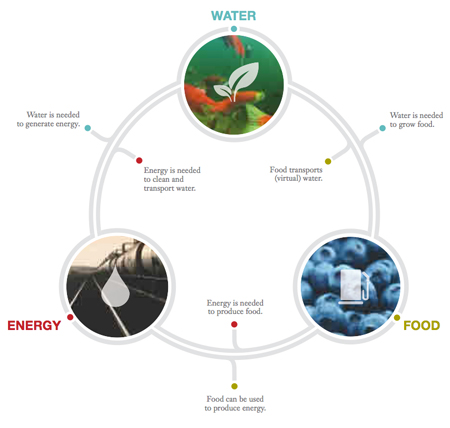
Virtual Water and Water Footprints
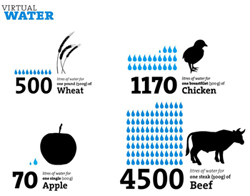
What is basic—yet important—to understand is that virtual water content refers to the total amount of freshwater used to produce a commodity or service.
Virtual water is a useful tool in understanding embodied water, but it is not perfect. For example, it does not consider the source of the water being used, nor does it take into account whether that water could have been used for other purposes. For example, growing wheat in a rain-fed plain is more responsible than growing irrigated wheat in an arid region. Still, virtual water is an important new data point that can help inform public policy. And if it were ever extended to consumer labeling, it could significantly increase consumer awareness and change buying behavior.
Virtual water content: The virtual-water content of a product is the freshwater “embodied” in the product, not in real sense, but in virtual sense. It refers to the volume of water consumed or polluted for producing the product, measured over its full production chain. If a nation exports/imports such a product, it exports/imports water in virtual form. The ‘virtual-water content of a product’ is [essentially] the same as ‘the water footprint of a product’, but the former refers to the water volume embodied in the product alone, while the latter term refers to that volume, but also to which sort of water is being used and to when and where that water is being used.
Water footprint:The water footprint is an indicator of freshwater use that looks at both direct and indirect water use of a consumer or producer. The water footprint of an individual, community or business is defined as the total volume of freshwater that is used to produce the goods and services consumed by the individual or community or produced by the business. Water use is measured in terms of water volumes consumed (evaporated) and/or polluted per unit of time. A water footprint can be calculated for a particular product, for any well-defined group of consumers (e.g. an individual, family, village, city, province, state or nation) or producers (e.g. a public organization, private enterprise or economic sector). The water footprint is a geographically explicit indicator, not only showing volumes of water use and pollution, but also the locations.
Canada’s Water Footprint
By looking at Canadian diet and consumption habits, it is possible to understand Canada’s relatively large water footprint (more than twice of most other countries).
The white dashed circle indicates the the sum of our water withdrawals from domestic sources (122.7 giga cubic metres).
The blue circle indicates the size of Canada’s water footprint, which reflects the sum of our water withdrawals from domestic sources (plus) Imported Virtual Water (minus) Exported Virtual Water.
For example:
- Water withdrawals from domestic sources (122.7 giga cubic metres) (+) Imported Virtual Water (35.4 giga cubic metres) = 158.1 giga cubic metres
- LESS – Exported Virtual Water (95.3 giga cubic metres)
- EQUALS = Canada’s water footprint of 62.8 giga cubic metres
Here we see Canada is a net exporter of its own water. The droplet going into the circles illustrates Canada’s water footprint of imports. The droplet going out of the circle illustrates the water footprint of Canadian exports. Again, this indicator is not included in Canada’s overall or per capita water footprint; instead, it is included in the water footprint of whichever country consumes these exported commodities.
Lastly, the bolded number (2,048.9 cubic meters) is Canada’s water footprint per capita, per year. This compares to 1,404 for Argentina, and 1,393 for Australia, and 1,223 for the Netherlands, and 1,218 for Pakistan . 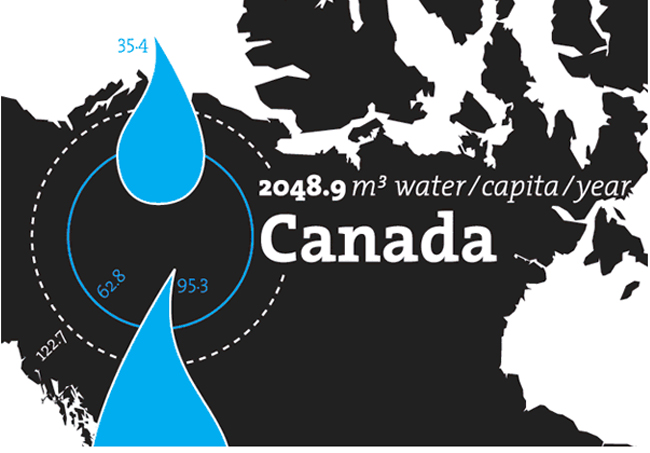
Graphic Source: Timm Kekeritz (http://www.virtualwater.eu)