Household Water Use in Alberta
Access to water, water use, and water conservation are of increasing concern to all Albertans as our population grows and our water resources remain finite. Individual Albertans can help by managing water use in their own homes. This case study provides insight on average household water use for two Alberta municipalities, the Town of Cochrane and City of Edmonton. Cochrane is in southern Alberta, in the Bow River Basin (a sub-basin of the South Saskatchewan River Basin (SSRB)). Since 2006, the Approved Water Management Plan for the SSRB has limited water access in this water-stressed region by formally closing the basin to applications for new surface water licenses (click to read more about water management in the Bow River Basin). This Approved Water Management Plan provides guidance to water users to balance water allocation needs while respecting the needs of the aquatic environment [1]. The City of Edmonton is in the North Saskatchewan River Basin which does not yet have an approved water management plan, although demands in that basin are increasing as industrial and municipal growth accelerates.
One of the many strategies for water conservation and improving water efficiency at the municipal level is to reduce household water use. This strategy is of particular importance because of the potential for large scale benefits from small scale actions as well as cultivating an awareness of water use and sense of personal responsibility with individual residents.
When analyzing daily household water use, it is important to consider only the water used in the households. Inconsistencies in separating industrial per capita use, differentiating between seasons, and defining household size, were several barriers to accessing these data. Most municipalities produce water use numbers per capita, which include commercial, light industrial and other non-household uses. This is not helpful for people who want to benchmark their water use against other households.
For the two municipalities where meaningful household water use is available, the figure below shows the impact of various household activities on residential water use, using the most updated information provided by each municipality.
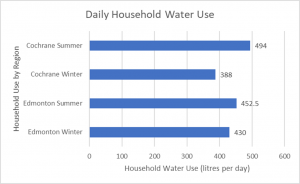
Figure 1 Daily household water use in litres per day for Cochrane and Edmonton. Water use values were gathered via publicly available information published by each municipality using the most recent available data.
Household water use fluctuates seasonally due the use of treated water for outdoor irrigation of lawns and gardens, which will also impact calculations of water use. As demonstrated in the figure above, in 2023 the household use in multi-person inhabited dwellings in Cochrane fluctuated by 106 litres per day between the summer and winter months [2]. In the summer, each household used an average of 494 litres daily, compared to 388 litres each day in the winter [3]. Edmonton households also demonstrate seasonal water demand change, using 452.5 litres each day in the summer, compared to 430 litres each day in the winter [4].
This difference is due to water use for outdoor watering during the summer months. The City of Calgary notes that using a sprinkler on your lawn can use up to 950 litres per hour per household [5]. Outdoor irrigation can quickly use water, threatening conservation efforts as the province works to fulfill demand in the face of limited resources [6]. Calgarians proved that collective actions lead to real change when outdoor watering restrictions saved an estimated 1.1 billion litres of water one month after the city issued restrictions amid drought conditions in 2023 [7]. On a per-day basis, the watering restrictions reduced water use by approximately 17.9 litres per person per day [7][8].
Another important element for understanding these data is the impact of multi-person inhabited households on water efficiency. Cochrane notes that the average household size was 2.6 persons in 2021, and Edmonton notes household size was 2.5 in 2019 [9][10]. Water-intensive tasks like running the dishwasher or washing machine optimize efficiency when loads are full [11].
Initially, more municipalities were to be included in this research article. However, Cochrane and Edmonton were the only municipalities providing up-to-date and consistently defined household water use. Research indicated that other municipal, provincial, and federal sources generally report on per capita water use, which typically includes all water use types within a jurisdiction. Residential (household) water use is often grouped together with industrial, business, and institutional water use in addition to water lost through leaks in the distribution system. Therefore, a per capita water use value often does not truly represent water use for an individual resident.
Access to current and consistently defined measures of daily household water use is integral to developing water conservation targets and tracking progress towards those targets, both at an individual level and at the service provider level. As water management grows in importance, awareness of regionally specific water use standards is necessary for individuals to understand how their household use plays a role in their community’s drought preparedness, infrastructure planning, and environmental impact. Given the contrast between Alberta’s winter and summer months, it is particularly important that data for both winter and summer use are made available as municipalities are increasingly implementing outdoor summer water use restrictions.
In summary, awareness of personal water use plays a role in responsible consumption, accountability, and informed goal setting. Publicly available data on household water use are needed across the board to build that awareness and accountability, particularly in southern Alberta where water conservation is of increasing concern to all water users. This is a call to action for all municipalities to review their policies and practices for summarizing and publicly delivering useful household water use statistics.
References
[1] https://open.alberta.ca/publications/0778546209
[7] https://www.cbc.ca/news/canada/calgary/water-restrictions-calgary-drought-1.6980691
[8] https://regionaldashboard.alberta.ca/region/calgary/population/#/?from=2018&to=2022
Graphic References
Cochrane Data
Edmonton Data