Waterborne Pathologies – Harmful Algal Blooms and Cyanobacterial Toxins
What is pathology?
At its core and most basic definition, pathology is the study of infectious organisms and their impact on human health. In a very broad sense, pathology encompasses all human infections and the complications and diseases they cause. It focuses on “pathogens”, the unit of infection, be it the tetanus bacteria that enters the bloodstream after stepping on a rusty nail, or the COVID virus that can enter your lungs if someone infected were to cough on you. These are both “pathogens”, and pathology is the study of these things and how the human body responds to them.
Of course, this general definition is far too broad and covers far too many of these pathogens, and so we can narrow them down into smaller groups. One of these ways you can do this is by discussing how they can be spread and transmitted. Waterborne pathogens are those which pass to humans using water as its medium of transport. In the urban areas of countries like Canada, we have extremely thorough water treatment methods which have led to much lower levels of contamination in the water we drink and bathe in. This does not mean we are free from these microscopic critters that can cause us harm. An example of a waterborne pathogen that is widely prevalent in Canadian waterways despite thorough water treatment, is Cyanobacteria.
What are Cyanobacteria?
| Cyanobacteria, commonly known as “blue-green algae”, are a form of bacteria categorized as phototrophs; able to perform photosynthesis, one of the foundational chemical processes that keeps our world oxygenated. These Cyanobacteria are one of the most efficient and largest groups of phototrophic prokaryotes, and they account for approximately 25% of global carbon fixation (the process in which carbon dioxide is converted into organic compounds). They are also responsible for the first ever creation of oxygen in our atmosphere when they appeared on the scene 2.3 billion years ago [i], and their extraordinary talent for producing oxygen initiated one of the first mass extinction events in our Earth’s history [ii].
Nearly all the organisms around during that time were anaerobic, meaning they survived without the use of oxygen, since there had never been oxygen in the atmosphere before. When these little algae began mass producing oxygen, it started to react with the other components of our atmosphere, and before long, it almost entirely replaced the methane (a greenhouse gas) which had been keeping the planet warm as an insulator. This was known as the Great Oxidation Event, and the planet cooled to a point where ice sheets spread from the poles of the planet all the way to the tropics; these bacteria had directly caused one of the first ice ages. |
All this is to say, these microorganisms have one of the most significant impacts on our world both historically and currently. They are crucial to regulating carbon waste and oxygen in our ecosystems, and their utility has been well respected with researchers beginning to use them in the production of renewable biofuels [iii]. However, they also pose a risk to humans in the form of “harmful algal blooms”. Typically, algal blooms are beneficial to aquatic ecosystems as they can produce an abundance of biofuels to be consumed by all manners of creatures. They can become harmful to not only aquatic organisms, but also to humans as they can contaminate the water we drink and swim in. Cyanobacteria are not pathogens themselves. When they die, they release toxins which are the pathogenic culprits that contaminate water and cause harm to humans [iv].
Prevalence in Freshwater Systems – What do they love to grow in?
So now that we have a collective understanding of what Cyanobacteria are, we can dive into the type of environments they love to thrive in . These bacteria, like any other organism, thrive where there is an abundance of nutrients and food for them to consume. In their case, they are particularly prevalent in waterways where there is a high concentration of nitrogen and phosphorus [v]. Lakes regulate the concentration of these nutrients by retaining a certain percentage within their waters, with the rest being dispersed through other organisms or lake sediment (see image below). This regulatory cycle, known as the phosphorous cycle, is not always stable, and can be disrupted by several different factors like climate, pollution, or water contamination by humans [vi]. When this biogeochemical cycle is disrupted and we end up with a large increase in nutrients in lakes, it‘s called eutrophication. These bacteria also love slow moving water bodies, like lakes, and higher water temperatures [vii]. When the waters are slow moving, it allows the Cyanobacteria to pool together, collecting at the surface of the waterway. If these waters were to become rougher, these bacteria would be separated and spread out, partially decreasing their bloom potential.
| When you combine these factors (excess nutrients, slow moving/stationary water, high temperatures), you have the perfect environmental conditions for a harmful algal bloom. It is understandable, then, why these algal blooms have been increasing over the past decades. Climate change has led to an increase in the global average temperature, causing lakes to rise to higher temperatures in the summer months. Additionally, studies have shown that in Ontario, algal blooms are most common in areas where there is substantial overlap of humans and lakes, with a lower prevalence in less populated areas [ix].
It is important to remember, algal blooms are naturally occurring, were around long before humans started polluting waterways and can be beneficial to water ecosystems. However, due to increasing external factors they can become harmful, not only to us, but to the aquatic ecosystems they have helped to build. |
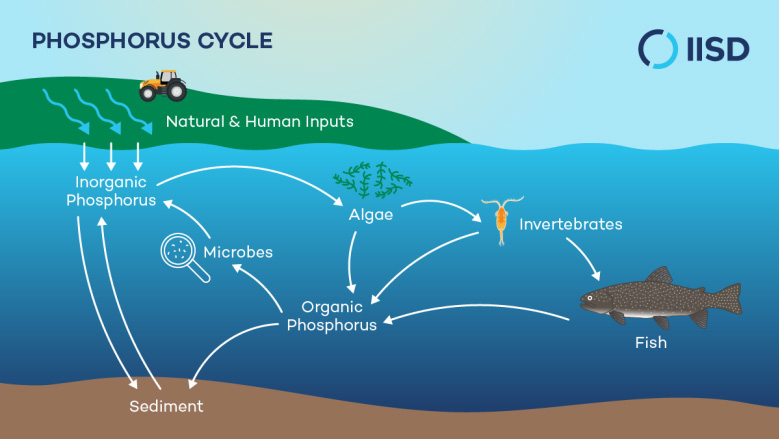 The phosphorus cycle. Source: Dickenson, L., 2022, Back to basics: How and why phosphorus cycles through a lake. |
Human Health Impacts
Understanding the risk the bacteria can pose to humans is critical, especially considering these harmful algal blooms can occur in lakes in areas with high human use. It could be a favourite lake for locals to swim in during the summer months to provide a reprieve from the heat. Independent research agencies and local governments work hard to continually monitor lakes to ensure advisories are mass distributed with proper warnings [x]. Canada has more lakes than any other country in the world [xi], and therefore it can be difficult to constantly monitor every at risk lake.
As per the government of Canada Health Services, exposure to Cyanobacteria toxins can occur through the following [xii]:
- Swallowing contaminated water
- Skin contact
- Breathing in water drops that contain toxins
These are all results of recreational use of waterways containing blooms. The symptoms of exposure can be extremely varied and include the following:
- Skin, eye, nose, and throat irritation
- Stomach pain, diarrhea, and vomiting
- Headaches, muscle weakness, and fever
With only a few cases reported worldwide, exposure can be fatal to humans. I say this with a heavy emphasis on its rarity. It is important to note that animals (e.g. pet dogs) are more susceptible to fatalities from these toxins than humans, so make sure to avoid these waterways entirely if possible and keep animals well under control.
Cases in Canada – How to recognize a bloom
As mentioned, reports of harmful algal blooms have increased over the past few decades [xiii], caused by a number of factors. Lake Winnipeg has been one of Canada’s lakes with the highest recurrence of algal blooms. It has been called “Canada’s sickest lake” and “the most threatened lake in the world” due to its susceptibility to eutrophication [xiv]. Meanwhile in Alberta, the Alberta Health Services has issued more than 30 Cyanobacteria health advisories for different lakes and reservoirs across the province since June 5th of this year (2024) [xv].
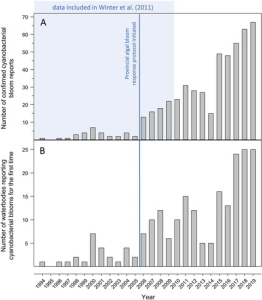
Figure 3: A graph depicting the number of algal blooms reported and confirmed in Ontario from 1994 to 2019 [xvi]
- The form for Alberta can be found here [xviii].
- The form for BC can be found here [xix]
- The form for Ontario can be found here [xx]
- For more information on identifying these blooms, you can visit this site [xxi].
Conclusion
To conclude, Cyanobacteria are magnificent and complex microorganisms crucial to the management of our ecosystems and were one of the founding pillars which allowed for aerobic life on Earth to develop and thrive. We owe them a debt of gratitude best paid by limiting the pollution of water bodies, ensuring they do not grow out of control and cause harm to ecosystems and humans. Prevention over treatment is always the preferred method of dealing with pathogens. Remember to avoid algal blooms and report them if seen. Let’s be responsible with our precious lakes and ensure that the generations to come can enjoy them as we have.
Author
Brendan Bate. Recently I graduated from Queen’s University, achieving an undergraduate degree in Life Sciences and Economics with a focus on pathology and microbiology. I have been working as an intern for the Alberta WaterPortal for the past few months.
Sources
[i] Mehdizadeh Allaf, M., & Peerhossaini, H. 2022, Cyanobacteria: Model Microorganisms and Beyond. Microorganisms, 10(4), 696. https://doi.org/10.3390/microorganisms10040696. Accessed 2024-08-28
[ii] Aiyer, K., 2022, The Great Oxidation Event: How Cyanobacteria Changed Life. https://asm.org/Articles/2022/February/The-Great-Oxidation-Event-How-Cyanobacteria-Change. Accessed 2024-08-28
[iii] Mehdizadeh Allaf, M., & Peerhossaini, H. 2022. Cyanobacteria: Model Microorganisms and Beyond. Microorganisms, 10(4), 696. https://doi.org/10.3390/microorganisms10040696. Accessed 2024-08-28
[iv] Mehdizadeh Allaf, M., & Peerhossaini, H. 2022. Cyanobacteria: Model Microorganisms and Beyond. Microorganisms, 10(4), 696. https://doi.org/10.3390/microorganisms10040696. Accessed 2024-08-28
[v] Government of Canada, 2024-06-13, Recreational water and health: Cyanobacteria and their toxins. https://www.canada.ca/en/health-canada/services/environment/recreational-water/cyanobacteria-toxins.html#a2. Accessed 2024-08-28
[vi] Dickenson, L. 2022, BACK TO BASICS: How and Why Phosphorus Cyckes through a lake. https://www.iisd.org/ela/blog/back-to-basics-how-and-why-phosphorus-cycles-through-a-lake/. Accessed 2024-08-28
[vii] Government of Canada, 2024-06-13, Recreational water and health: Cyanobacteria and their toxins. https://www.canada.ca/en/health-canada/services/environment/recreational-water/cyanobacteria-toxins.html#a2. Accessed 2024-08-28
[viii] Dickenson, L. 2022, BACK TO BASICS: How and Why Phosphorus Cyckes through a lake. https://www.iisd.org/ela/blog/back-to-basics-how-and-why-phosphorus-cycles-through-a-lake/. Accessed 2024-08-28
[ix] Favot, E. J., Holeton, C., DeSellas, A. M., & Paterson, A. M. 2023, Cyanobacterial blooms in Ontario, Canada: continued increase in reports through the 21st century. Lake and Reservoir Management, 39(1), 1–20. https://doi.org/10.1080/10402381.2022.2157781. Accessed 2024-08-29
[x] Government of Canada, 2020-09-01, EOLakeWatch: Remote sensing of algal blooms. https://www.canada.ca/en/environment-climate-change/services/water-overview/satellite-earth-observations-lake-monitoring/remote-sensing-algal-blooms.html. Accessed 2024-08-25
[xi] Government of Canada, 2013-09-09, Water sources: lakes. https://www.canada.ca/en/environment-climate-change/services/water-overview/satellite-earth-observations-lake-monitoring/remote-sensing-algal-blooms.html. Accessed 2024-08-25
[xii] Government of Canada, 2024-06-13, Recreational water and health: Cyanobacteria and their toxins. https://www.canada.ca/en/health-canada/services/environment/recreational-water/cyanobacteria-toxins.html#a2. Accessed 2024-08-28
[xiii] Stephen S. Bates et al., 2020, Marine harmful algal blooms and phycotoxins of concern to Canada. https://publications.gc.ca/site/eng/9.888345/publication.html#:~:text=%22In%20Canada%2C%20reports%20of%20marine%20harmful%20algal%20blooms,phytoplankton%20that%20produce%20phycotoxins%20or%20otherwise%20cause%20harm. Accessed 2024-08-26
[xiv] Ali, G., 2019, Phytoplankton blooms in Lake Winniped linked to selective water-gatekeeper connectivity. https://www.nature.com/articles/s41598-019-44717-y#citeas. Accessed 2024-08-28
[xv] Alberta Health Services, 2024, Cyanobacteria (Blue-Green Algae) Health Advisories. https://www.albertahealthservices.ca/news/bga.aspx. Accessed 2024-08-28
[xvi] Favot, E. J., Holeton, C., DeSellas, A. M., & Paterson, A. M. 2023, Cyanobacterial blooms in Ontario, Canada: continued increase in reports through the 21st century. Lake and Reservoir Management, 39(1), 1–20. https://doi.org/10.1080/10402381.2022.2157781. Accessed 2024-08-29
[xvii] Government of Canada, 2023-03-07, EOLakeWatch: Annual algal bloom summary reports. https://www.canada.ca/en/environment-climate-change/services/water-overview/satellite-earth-observations-lake-monitoring/annual-algal-bloom-summary-reports.html. Accessed 2024-08-25
[xviii] Contact Environmental Public Health · Alberta Health Services
[xix] Report All Poachers and Polluters (RAPP) – Environmental Protection & Sustainability Forms (gov.bc.ca)
[xx] Report Pollution | Ontario.ca (gov.on.ca)
[xxi] Ontario, 2024-04-02, Blue-green algae. https://www.ontario.ca/page/blue-green-algae#section-1. Accessed 2024-08-25
ED’s corner: Happy (belated) World Water Day 2024!

As I settle down to read the latest UN Water Report, Water for prosperity and peace, it occurs to me that water issues in western Canada are receiving a level of attention they deserve but seldom receive. A great deal of water shortage (aka drought) planning is underway in Alberta and BC. Meanwhile in Ontario, the snow pack is also below average. So, unless something changes sharply we are probably in for another year of water supply worries.
We Tweeted (X’ed?) a selection of stories from around the world related to World Water Day on March 24th as part of our weekday news clipping service. We focused on stories and links to what we thought you’d find interesting and informative. On a personal level, I’m intrigued by the announcement of the Google freshwater hub. Based on a quick look, there is a lot of educational material on the hub. If you’re in the world of teaching school children about water and are looking to include some global content, I suggest you take a look.
So, on to the UN report…
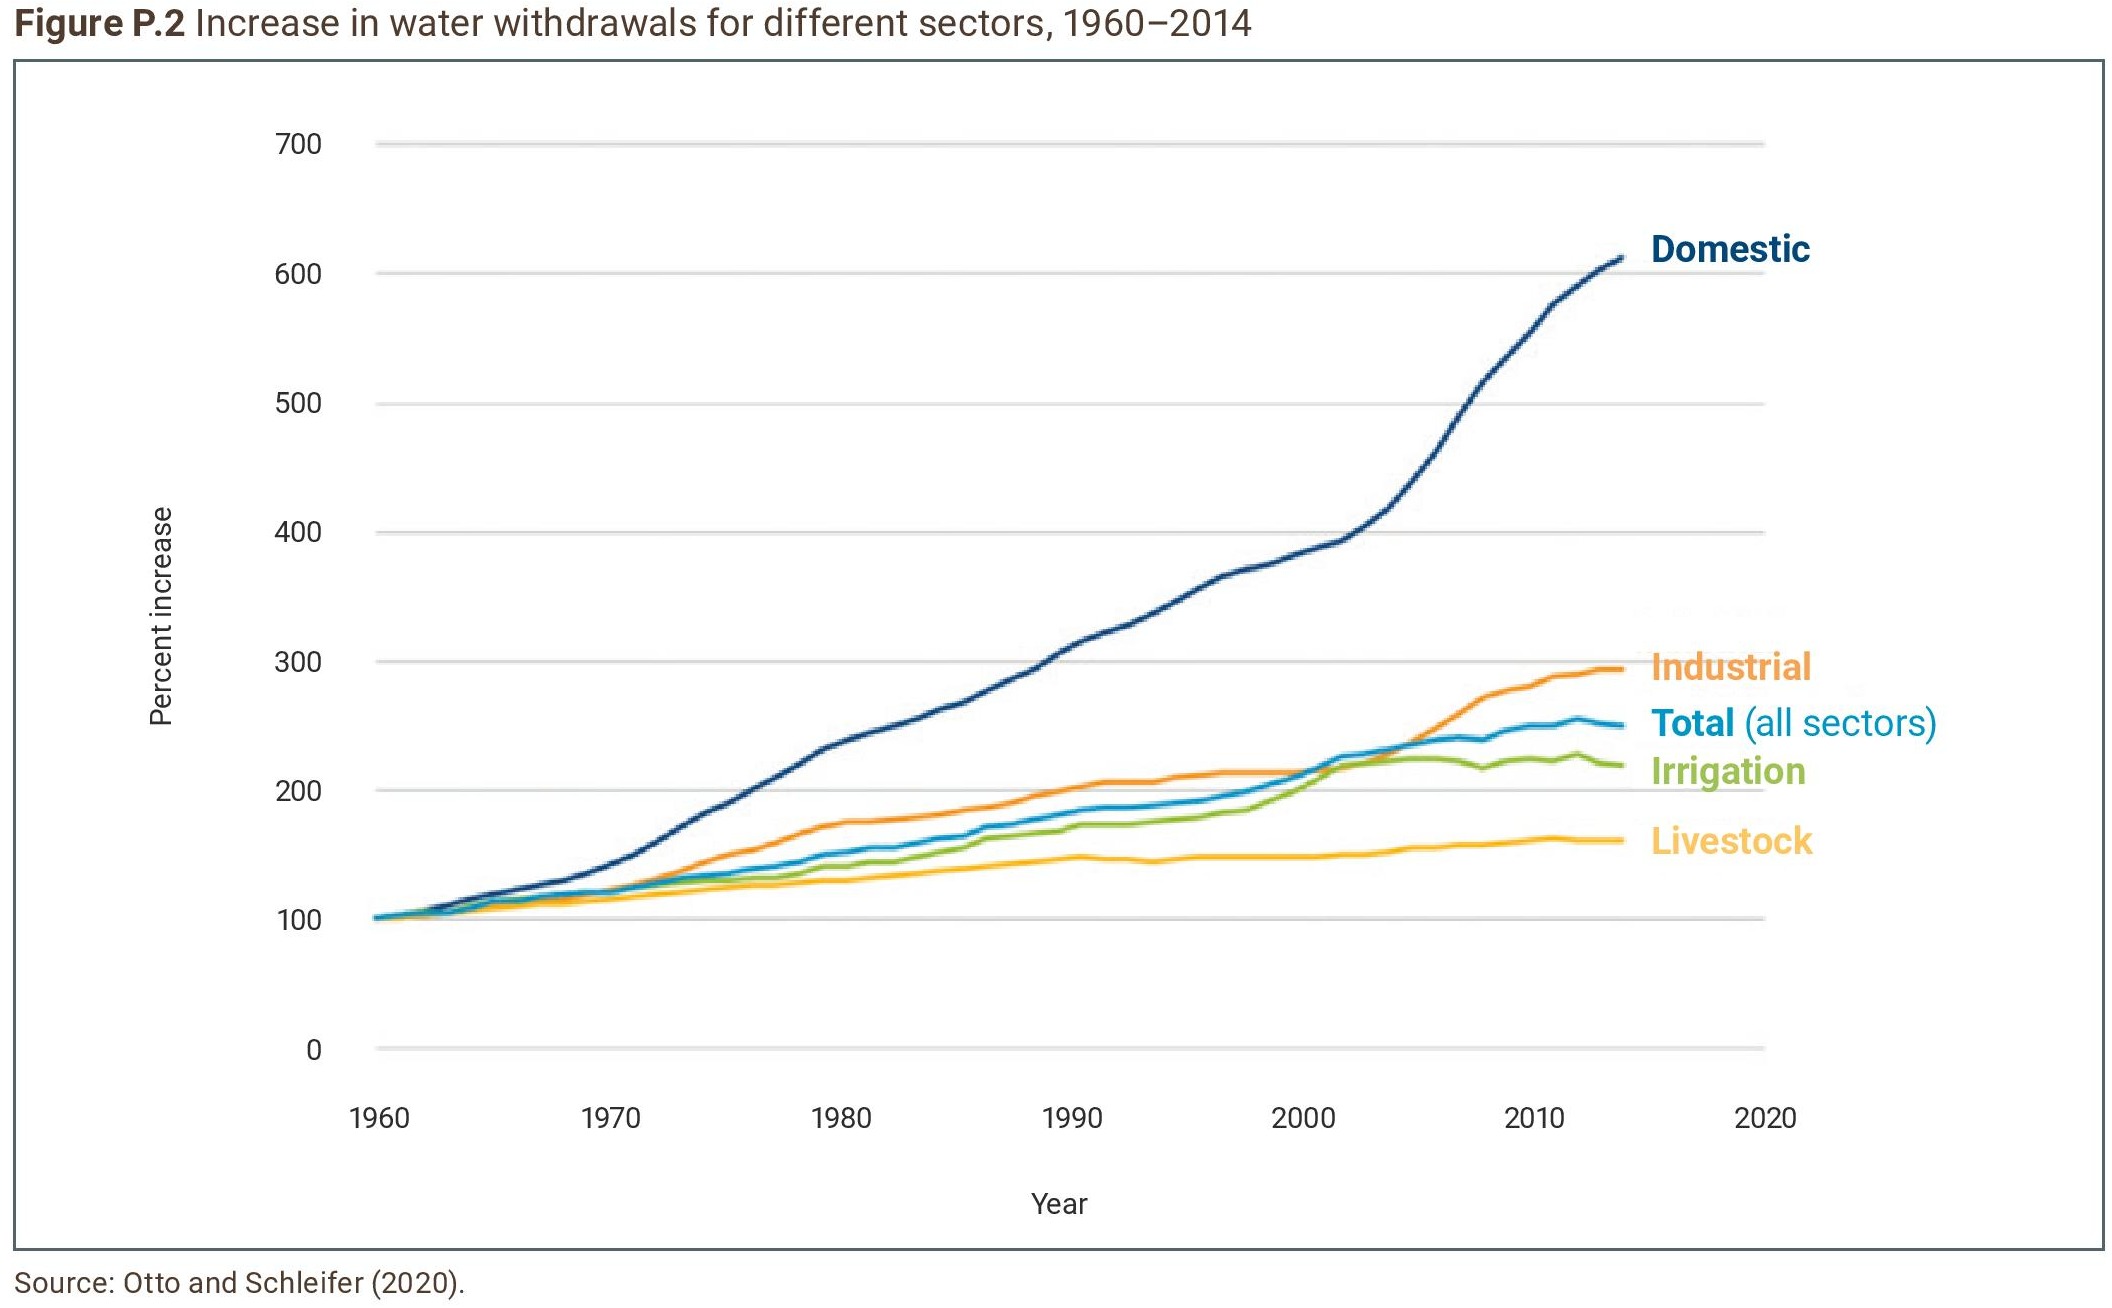 Increase in water withdrawals 1960-2014. Source: UN World Water Development Report 2024. |
The UN’s “World Water Development Report 2024” is the latest of a series of reports published on World Water Day. This year’s report, “Water for peace and prosperity” follows 2023’s “Partnerships and cooperation for water” and continues highlighting positive aspects of our water stresses. By the way, the 2022 report, “Groundwater: making the invisible visible” is well worth a read if you have any interest in the looming groundwater challenges.
This year’s report, as should be expected from the title, is focused on highlighting how water security through sustainable water management leads to prosperity which, if equitably shared, can lead to peace. I suspect we have all heard the saying to the effect of “the next wars will be over water”. The report’s authors tackle that saying head on by consciously highlighting where water cooperation, especially in the transboundary arena has helped promote interjurisdictional dialogue and cooperation. In closing, the report goes on to state that water is not “yet … a trigger of conflict” (p.149) while noting and deploring reports of attacks on water infrastructure (e.g. Kakhovka Dam) as against international law. Personally, I don’t find the “yet” reassuring… The report is broken into chapters on given topics (listed below). The chapters are not long and are targeted at a general audience so not particularly technical. It makes it easy to dive in and quickly read a topic of particular interest. |
2024’s Chapter Headings
| Prologue
1: Introduction 2: Agriculture and rural development 3: Human settlements: WASH, disaster risk reduction and migration 4: Industry 5: Energy 6: Environment |
7: Transboundary cooperation
8: Regional perspectives 9: Governance 10: Science, technology and information 11: Education and capacity development 12: Financing water security and mitigating investment risks 13: Conclusions |
Some factoids/excerpts from the report:
|
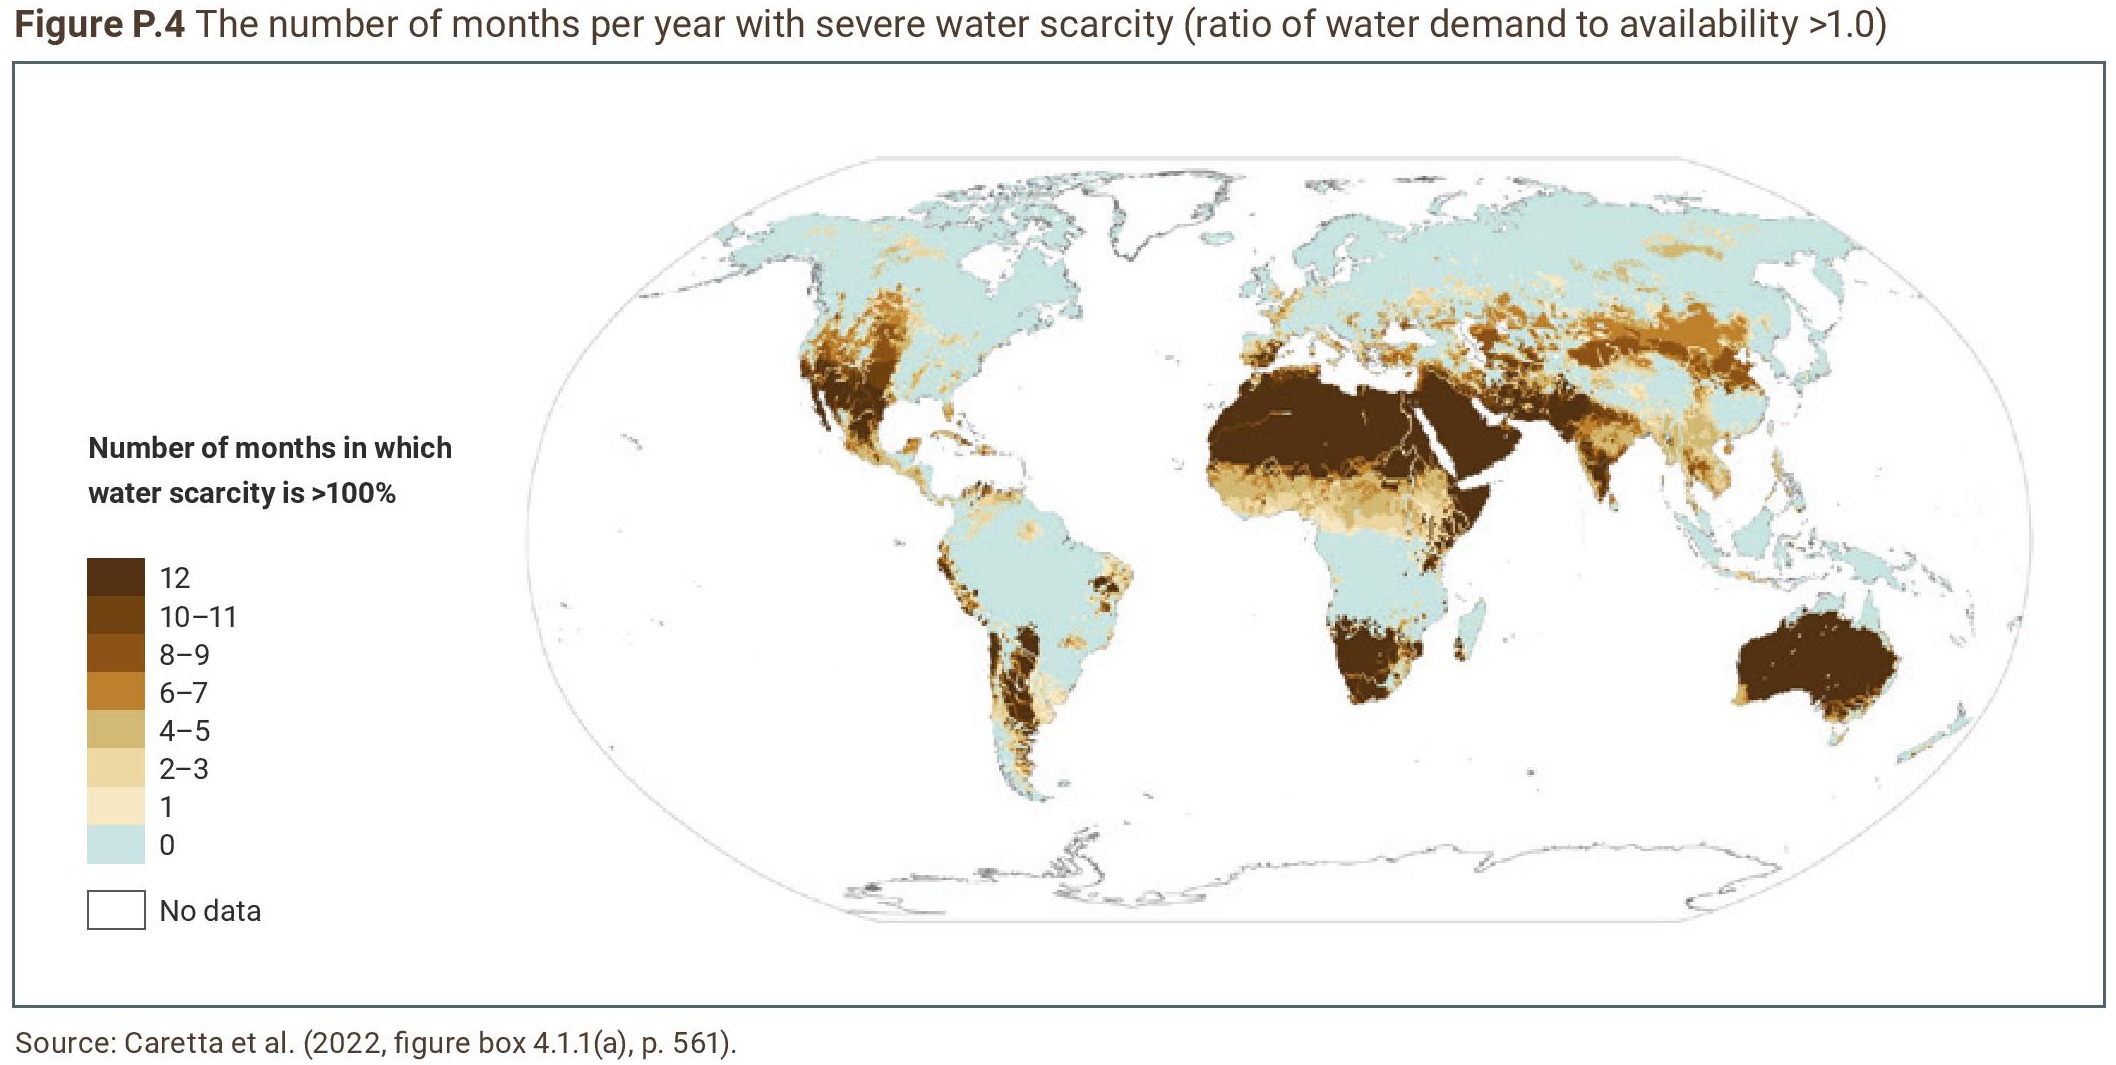 Months/Year of demand > supply. Source: UN World Water Development Report 2024. |
Given we are the WaterPortal and are focussed on water education, I am particularly pleased to be able to offer up the following closing quote:
“Education remains the foundation to change human behaviour and build consensus for sustainable approaches to water services provision and resources management (UNESCO-IHP, 2022). Water education is therefore key … “ (p.134)
And so, in closing off this brief overview, I’d like to thank you for your interest in water and your support of the WaterPortal. May we all have a year in which we receive just the right amount of water!
Source:
United Nations, 2024, The United Nations World Water Development Report 2024: Water for Prosperity and Peace. UNESCO, Paris. https://www.unwater.org/publications/un-world-water-development-report-2024. Accessed 2024-03-26.
Household Water Use in Alberta
Access to water, water use, and water conservation are of increasing concern to all Albertans as our population grows and our water resources remain finite. Individual Albertans can help by managing water use in their own homes. This case study provides insight on average household water use for two Alberta municipalities, the Town of Cochrane and City of Edmonton. Cochrane is in southern Alberta, in the Bow River Basin (a sub-basin of the South Saskatchewan River Basin (SSRB)). Since 2006, the Approved Water Management Plan for the SSRB has limited water access in this water-stressed region by formally closing the basin to applications for new surface water licenses (click to read more about water management in the Bow River Basin). This Approved Water Management Plan provides guidance to water users to balance water allocation needs while respecting the needs of the aquatic environment [1]. The City of Edmonton is in the North Saskatchewan River Basin which does not yet have an approved water management plan, although demands in that basin are increasing as industrial and municipal growth accelerates.
One of the many strategies for water conservation and improving water efficiency at the municipal level is to reduce household water use. This strategy is of particular importance because of the potential for large scale benefits from small scale actions as well as cultivating an awareness of water use and sense of personal responsibility with individual residents.
When analyzing daily household water use, it is important to consider only the water used in the households. Inconsistencies in separating industrial per capita use, differentiating between seasons, and defining household size, were several barriers to accessing these data. Most municipalities produce water use numbers per capita, which include commercial, light industrial and other non-household uses. This is not helpful for people who want to benchmark their water use against other households.
For the two municipalities where meaningful household water use is available, the figure below shows the impact of various household activities on residential water use, using the most updated information provided by each municipality.
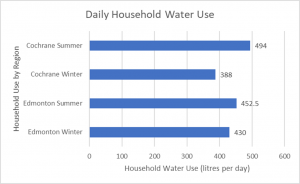
Figure 1 Daily household water use in litres per day for Cochrane and Edmonton. Water use values were gathered via publicly available information published by each municipality using the most recent available data.
Household water use fluctuates seasonally due the use of treated water for outdoor irrigation of lawns and gardens, which will also impact calculations of water use. As demonstrated in the figure above, in 2023 the household use in multi-person inhabited dwellings in Cochrane fluctuated by 106 litres per day between the summer and winter months [2]. In the summer, each household used an average of 494 litres daily, compared to 388 litres each day in the winter [3]. Edmonton households also demonstrate seasonal water demand change, using 452.5 litres each day in the summer, compared to 430 litres each day in the winter [4].
This difference is due to water use for outdoor watering during the summer months. The City of Calgary notes that using a sprinkler on your lawn can use up to 950 litres per hour per household [5]. Outdoor irrigation can quickly use water, threatening conservation efforts as the province works to fulfill demand in the face of limited resources [6]. Calgarians proved that collective actions lead to real change when outdoor watering restrictions saved an estimated 1.1 billion litres of water one month after the city issued restrictions amid drought conditions in 2023 [7]. On a per-day basis, the watering restrictions reduced water use by approximately 17.9 litres per person per day [7][8].
Another important element for understanding these data is the impact of multi-person inhabited households on water efficiency. Cochrane notes that the average household size was 2.6 persons in 2021, and Edmonton notes household size was 2.5 in 2019 [9][10]. Water-intensive tasks like running the dishwasher or washing machine optimize efficiency when loads are full [11].
Initially, more municipalities were to be included in this research article. However, Cochrane and Edmonton were the only municipalities providing up-to-date and consistently defined household water use. Research indicated that other municipal, provincial, and federal sources generally report on per capita water use, which typically includes all water use types within a jurisdiction. Residential (household) water use is often grouped together with industrial, business, and institutional water use in addition to water lost through leaks in the distribution system. Therefore, a per capita water use value often does not truly represent water use for an individual resident.
Access to current and consistently defined measures of daily household water use is integral to developing water conservation targets and tracking progress towards those targets, both at an individual level and at the service provider level. As water management grows in importance, awareness of regionally specific water use standards is necessary for individuals to understand how their household use plays a role in their community’s drought preparedness, infrastructure planning, and environmental impact. Given the contrast between Alberta’s winter and summer months, it is particularly important that data for both winter and summer use are made available as municipalities are increasingly implementing outdoor summer water use restrictions.
In summary, awareness of personal water use plays a role in responsible consumption, accountability, and informed goal setting. Publicly available data on household water use are needed across the board to build that awareness and accountability, particularly in southern Alberta where water conservation is of increasing concern to all water users. This is a call to action for all municipalities to review their policies and practices for summarizing and publicly delivering useful household water use statistics.
References
[1] https://open.alberta.ca/publications/0778546209
[7] https://www.cbc.ca/news/canada/calgary/water-restrictions-calgary-drought-1.6980691
[8] https://regionaldashboard.alberta.ca/region/calgary/population/#/?from=2018&to=2022
Graphic References
Cochrane Data
Edmonton Data
ED’s Corner: Welcome to 2024!
 Welcome back to the WaterPortal! We hope you had a wonderful break with family and friends and are looking forward to 2024.
Looking back
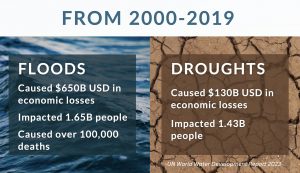
To start 2024 off, it might be worth having a quick look back at 2023. The global re-insurer, Munich Re, has released their 2023 retrospective summary Record thunderstorm losses and deadly earthquakes: the natural disasters of 2023 [1]. Apart from the appalling loss of life last year, some 74,000 dead, the headline number of $250 billion losses globally is striking [2]. As someone with a background in the intersection of water management and disaster/emergency management, I rather grimly noted the storm losses. While a portion of the total losses below was insured, the significant majority was not insured with consequent implications for the individuals and societies affected by the storms.
- April’s USA Midwest thunderstorms – $6 billion
- May’s European flooding – $10 billion
- June’s USA thunderstorms and tornado series – $5.6 billion
- July’s Asia Typhoon Doksuri – $25 billion
- October’s Mexico Hurricane Otis which, in model-straining behaviour, over 24 hours worsened from a “Tropical Storm” to a “Category 5” hurricane – ~$12 billion
| Climate scientists have for years been warning that the greater energy in the atmosphere will lead to more frequent and more intense storms (see, for a recent example, the Government of Canada’s 2023 Synthesis Report [3]). While one storm does not climate change make (to shamelessly butcher a saying), the global trend is indicative (e.g. Figure 1 in the UK [4], USA [5]).
Supporting this, Swiss Re, another major global reinsurer, notes in a recent press release [6] that thunderstorm losses in 2023 tested the primary insurance industry which will have inevitable consequences for our insurance premiums. Swiss Re further notes that severe thunderstorm losses have been increasing an average 7% per year for the last 30 years and that 2023 represented a 90% increase over the previous 5-year average. Of course, using a financial measure to rank events tends to exclude the catastrophic events happening in less-developed parts of the world. Mexico’s Hurricane Otis was unprecedented in how quickly it worsened. However, East Africa’s Cyclone Freddy was unprecedented in duration [7] and storm energy [8]: it hit Mozambique twice, killed some 1400 people and damaged already-limited health care systems [9], and other infrastructure across the region. So, all in all, 2023 was not a good year for storms. |
 Figure 1: Increasing depth of 1:20, 1:50 and 1:100 floods in the United Kingdom [4] |
Looking forward
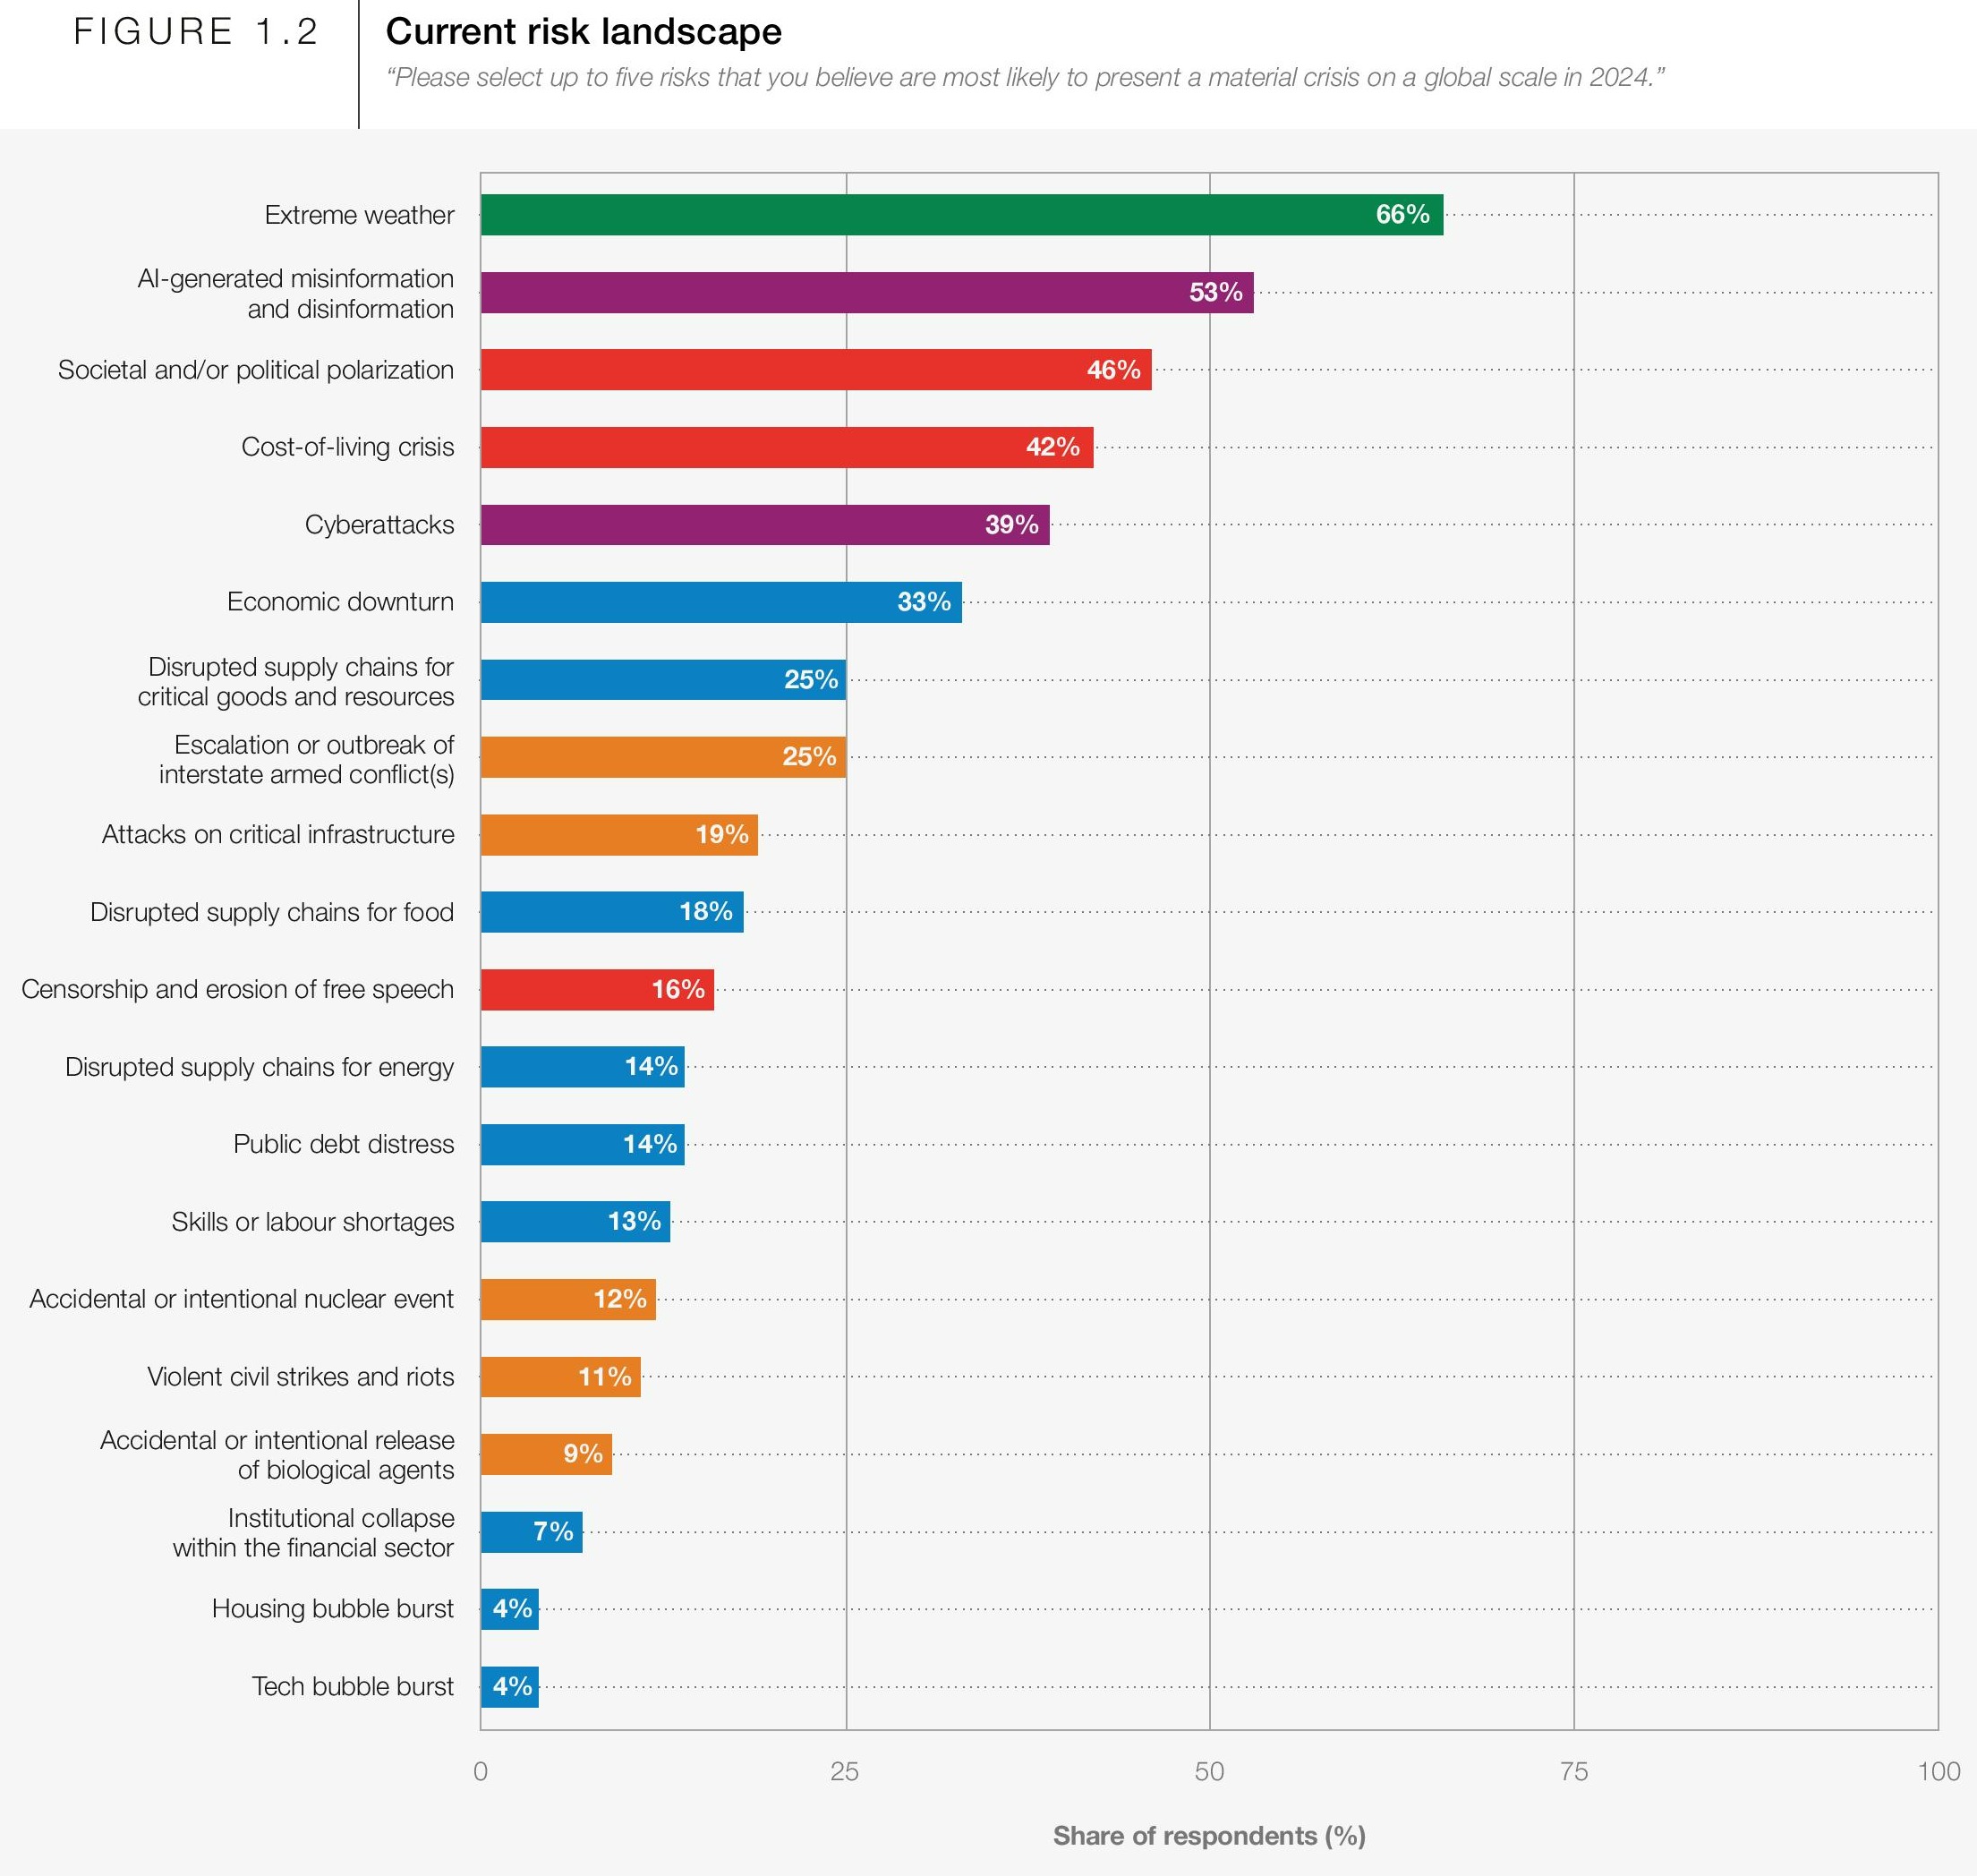 Figure 2 : Top risks for 2024 [10] |
Looking forward, the 19th annual Global Risks Report [10] (GRR24) from the World Economic Forum, listing the top 20 global risks for 2024 (Figure 2), has just been released. Worryingly, especially in the context of 2023, two thirds of those surveyed as part of developing GRR24 identified extreme weather as “the top risk most likely to present a material crisis on a global scale in 2024”, second-most severe risk over the next two years and the top risk over the next decade (Figure 3) [11]. This concern was shared across all types of respondents. In a nutshell, people are worried. Unsurprisingly. | 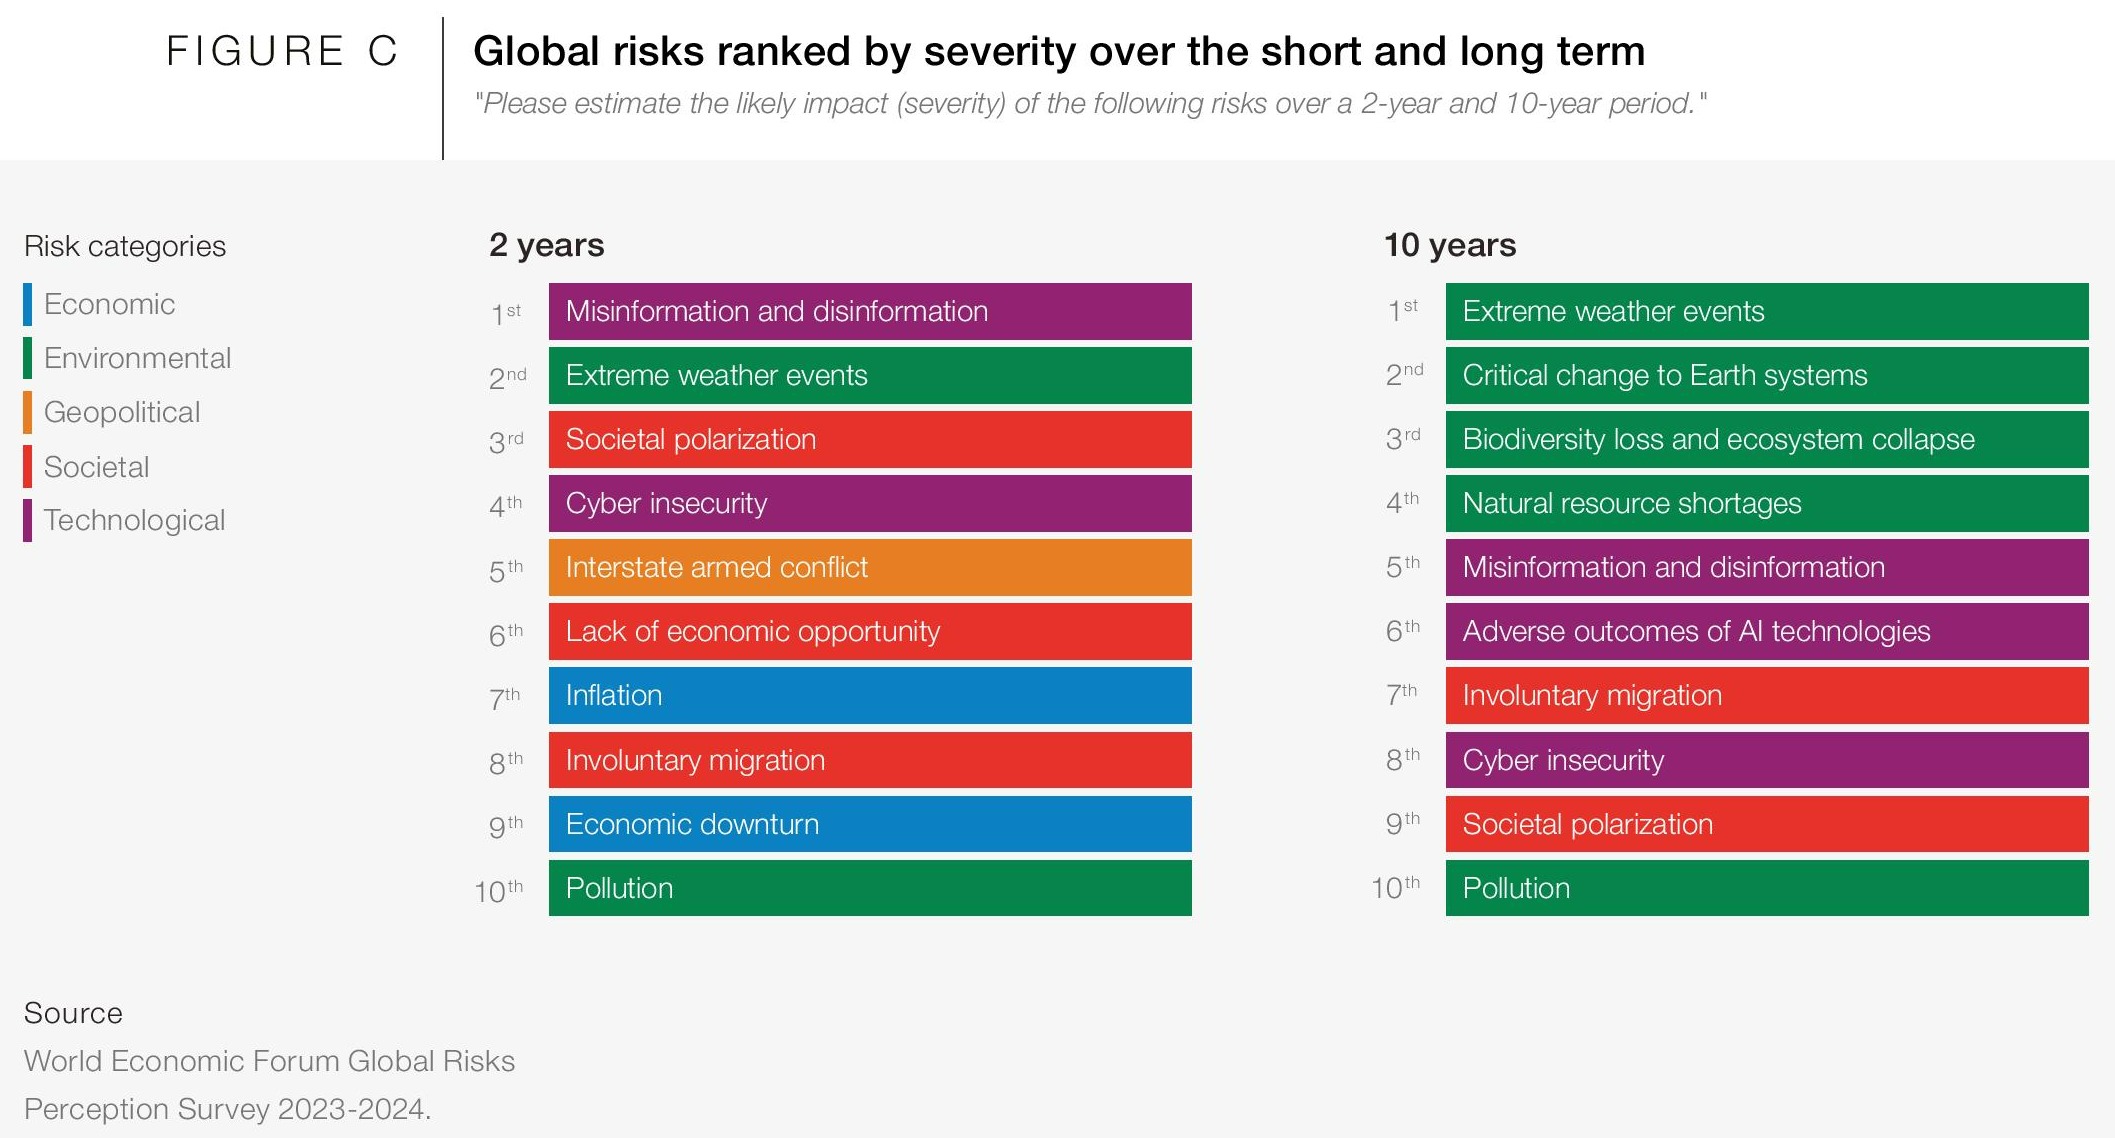 Figure 3: Global risks for 2024-2025 and 2024-2033. [11] |
Any good news out there?
On the more positive side: some 61% of GRR24 respondents thought that “National and local regulations” have potential for addressing the “Biodiversity loss and ecosystem collapse” risk. With respect to addressing “Critical change to Earth systems”, 65% thought that “Global treaties and agreements” had strong potential.
More tangibly, a Swiss Re analysis of the damage from Hurricane Ian [12] (Florida, USA, 2022, ~$65 billion) estimated that current building standards in Florida mitigated the structural damage loss potential by 90-100% compared to the standards of the 1970s.
What to do?
My intention in writing this was two-fold: 1) to welcome you to the new year, and 2) share the release of the Global Risks Report and the Munch Re 2023 summary. It was not to depress you. Promise!
Clearly, we are in a challenging situation. A changing, more dangerous, climate is intersecting with a growing global population and a growing collection of assets-at-risk. “Business as usual”, based on practices and beliefs of the last, say, 50 years is becoming increasingly untenable.
I believe we need a greater focus on disaster risk reduction at all levels: individual, community, national and international. While few of us may be able to exert much influence on national or international action, I do believe we can take all action at the individual level and many at the community level.
So, for 2024, I urge you to look at your own risk profile. Did you know, for example, that research in 2020 found that 94% of Canadians living in designated flood risk areas did not know that fact [13]? Given the growing risk of thunderstorms, are you in an area where hail is a threat [14] (Click here for an Institute of Catastrophic Loss Reduction map of hail days across Canada)? While we are the WaterPortal and, by mandate, focused on water-related topics, please look beyond your risk of flooding and storm damage. And don’t assume that insurance will cover your possible losses [15].
If this is completely new to you, start with taking a suspicious and pessimistic look at your daily life – what can go wrong? If it does, what will you do? What can you do to reduce the chance of a problem in the first place? What programs does your community have with respect to reducing your and the community’s risk?
Chat to your local disaster management folk – they will probably be delighted in your interest! And, they may well have local information for you and suggestions as to what you can do. And, of course, there is a lot of material on the internet (e.g. FloodSmart Canada, FireSmart Canada, HailSmart, earthquake hazard).
Good luck in 2024 – we wish you and your families a safe and happy year with just the right amount of water!
PS – we have exciting changes coming – keep an eye on the WaterPortal in the coming months!
Sources:
[1] https://www.munichre.com/en/company/media-relations/media-information-and-corporate-news/media-information/2024/natural-disaster-figures-2023.html. Accessed 2024-01-10.
[2] Munich Re Fact sheet: https://www.munichre.com/content/dam/munichre/mrwebsitespressreleases/MunichRe-NatCAT-Stats2023-Full-Year-Factsheet.pdf/_jcr_content/renditions/original./MunichRe-NatCAT-Stats2023-Full-Year-Factsheet.pdf. Accessed 2024-01-10.
[3] Lulham, N., Warren, F.J., Walsh, K.A. and Szwarc, J. (2023). Canada in a Changing Climate: Synthesis Report; Government of Canada, Ottawa, Ontario. http://www.changingclimate.ca/synthesis. Accessed 2024-01-10.
[4] Slater, L. & Hannaford, J., 2024, Extreme UK flood levels are happening much more often than they used to, analysis shows. https://theconversation.com/extreme-uk-flood-levels-are-happening-much-more-often-than-they-used-to-analysis-shows-220788. Accessed 2024-01-11.
[5] National Centers for Environmental Information, National Oceanic and Atmospheric Administration, 2024, Billion-Dollar Weather and Climate Disasters. https://www.ncei.noaa.gov/access/billions/time-series/US/cost. Accessed 2024-01-11.
[6] Swiss Re, 2023, Insured losses from severe thunderstorms reach new all-time high of USD 60 billion in 2023, Swiss Re Institute estimates. https://www.swissre.com/press-release/Insured-losses-from-severe-thunderstorms-reach-new-all-time-high-of-USD-60-billion-in-2023-Swiss-Re-Institute-estimates/4a15acf7-64b4-4766-8662-1c35d268ab12. Accessed 2024-01-10.
[7] BBC News, 2023, Freddy: The deadly cyclone that lasted more than a month. https://www.bbc.com/news/world-africa-64978492. Accessed 2024-01-10.
[8] Menga, M., 2023, Climate intelligence at work: the case of Cyclone Freddy. https://www.climateforesight.eu/articles/the-perfect-storm-the-extreme-power-of-cyclone-freddy/. Accessed 2024-01-10.
[9] UN News, 2023, Southern Africa: Cyclone Freddy aftermath brings diseases, healthcare gaps. https://news.un.org/en/story/2023/03/1134962. Accessed 2024-01-10.
[10] World Economic Forum, 2024, Global Risks Report 2024. https://www.weforum.org/publications/global-risks-report-2024/. Accessed 2024-01-10.
[11] Ibid. Page 7.
[12] Karaca, E., 2023, Ian revisited: Disentangling the drivers of US hurricane losses. https://www.swissre.com/risk-knowledge/mitigating-climate-risk/hurricane-ian-revisited.html. Accessed 2024-01-10.
[13] Partners for Action, 2020, Canadian Voices on Flood Risk 2020. https://uwaterloo.ca/partners-for-action/past-projects/canadian-voices-flood-risk-2020. Accessed 2024-01-10.
[14] Institute for Catastrophic Loss Reduction, https://www.iclr.org/hail-2/. Accessed 2024-01-10.
[15] CBC, 2024, As weather-related disasters mount, some Canadian homeowners can’t get insurance coverage. https://www.cbc.ca/news/climate/insurance-extreme-weather-1.7078544. Accessed 2024-01-10.
Water for Alberta’s Hydrogen Economy
The information below is drawn from a research report published in June 2023 by WaterSMART Solutions. This report, commissioned by Alberta Innovates, highlights the importance of water in the development of Alberta’s hydrogen economy (WaterSMART Solutions Ltd., 2023). Hydrogen production can have a similar level of water consumption to gasoline and diesel fuels, but the locations where new hydrogen facilities are proposed in Alberta could face water insecurity (Lampert, Cai, & Elgowainy, 2016). To date, limited research has been published regarding this topic, especially for water stressed regions that have visions for large scale hydrogen production. WaterSMART’s investigation concluded that water resources should be carefully considered in Alberta when planning the transition to a hydrogen future, because water use for hydrogen will compete with other water uses, such as for food, people, and the economy. As of the writing of this post, Alberta is facing one of the most severe droughts it has ever seen (see the Canadian Drought Monitor for more information), and this has the potential to impact Alberta’s people, industry, and environment. Our water supply should not be taken for granted.
Alberta has committed to reaching net zero emissions by 2050 and now must take actionable steps towards achieving this goal (Government of Alberta, 2023). The province is positioned to rapidly advance a hydrogen fuel economy, which has the potential to reduce emissions across many sectors. In addition to its existing uses in oil and gas refining, new hydrogen sources could be used to fuel vehicles and aircraft, heat homes, provide electricity, generate industrial feedstocks like ammonia and methanol, and more. In pursuing emissions reduction and climate change mitigation pathways, it is critical to consider other environmental, social, and economic impacts and trade-offs within the context of the water-energy-food nexus. One of the most important considerations, and the focus of this post, is Alberta’s shared, and finite, water resources.
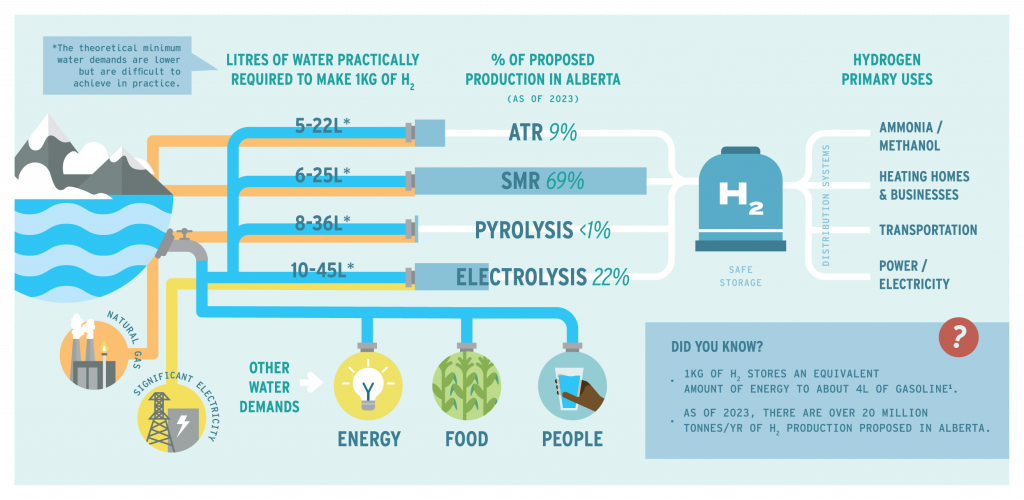
Figure 1: Summary of different hydrogen production technologies (ATR, SMR, Pyrolysis, and Electrolysis), all of which are discussed below, proposed in Alberta.
Water Supply across Alberta
The amount of water available for use varies regionally, seasonally, and year over year. There are regulations in place within Alberta that ensure that the freshwater flowing in Alberta’s lakes and rivers is shared between the environment, people, and industry. The main form of regulation is through water licences, which provincial regulators issue to water consumers after an application is submitted. Applications can be approved or denied based on local water availability. At certain times of the year, especially in the summer and early fall when all the snow has melted and rainfall is limited, some areas of our province can experience low water levels and even droughts. This occurs more frequently in the southern part of the province, where water is less abundant. During these times, some water users may have their access to water restricted under Alberta’s priority-based allocation system. This lack of water access is a material risk for hydrogen producers, and it is therefore critical to examine the current and future water availability in locations proposed for hydrogen development.
The following graph demonstrates how the streamflow changes seasonally and annually in three major rivers in Alberta. Keeping in mind that this streamflow must be shared among people, the environment, and other industry, this figure demonstrates how important it is to strategically locate operations with high water demands. In some places, the river may simply not have the necessary supply for a high demand.
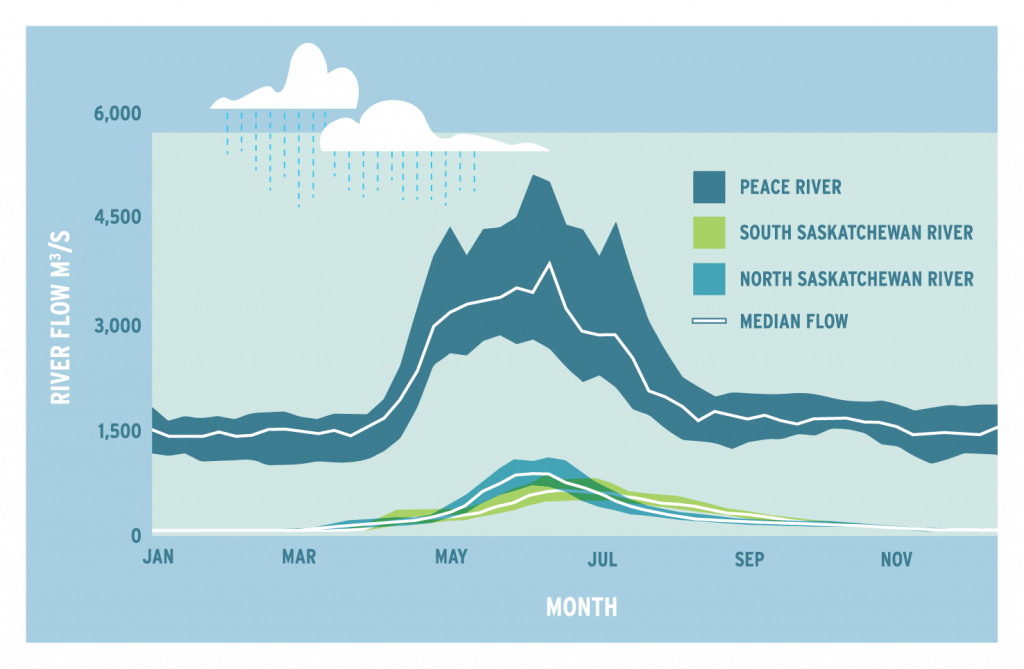
Figure 2: Visualization of river flows in different regions of Alberta, which vary seasonally and annually. The Peace River is in northern Alberta, while the North and South Saskatchewan are in the south.
Water Demand for Hydrogen Production
Hydrogen can be produced using a variety of techniques, several of which have been proposed in Alberta, and all of which require water. The main technologies are:
- Steam Methane Reforming (SMR)
- Autothermal Reforming (ATR)
- Electrolysis
- Pyrolysis
Each hydrogen production technology has different efficiencies and water consumption rates, which are detailed in the table below. Importantly, the theoretically achievable water consumption rate is lower than what is actually achievable. This is because of real world process inefficiencies as well as the need for water in plant cooling processes and high-quality water input to the process.
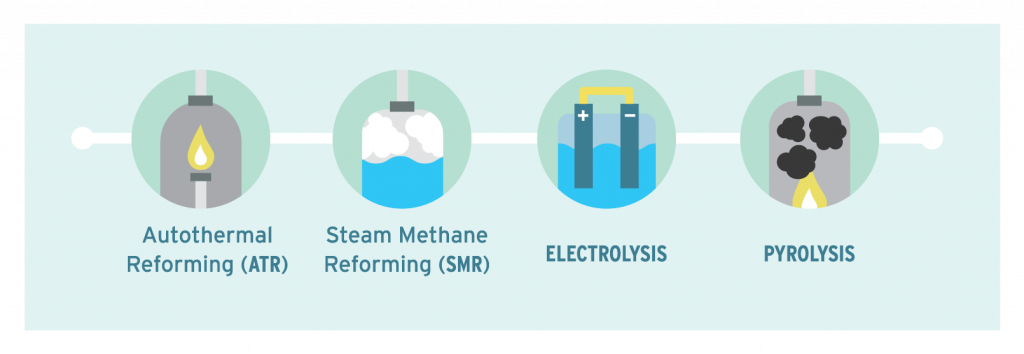
Steam Methane Reforming (SMR)
SMR is currently the most widely used technology for hydrogen production. While there are many different forms of SMR that use various catalysts and gaseous mixtures, the underlying method uses high temperatures to reduce methane (CH4) with water (H2O) into hydrogen (H2) and carbon dioxide (CO2). Many proposed SMR projects in Alberta have committed to capturing the CO2 with carbon capture technologies to reduce the emissions intensity of the hydrogen.
Autothermal Reforming (ATR)
Emerging as a competitor to SMR is ATR, which uses a similar process to SMR combined with partial oxidation. The main difference is that oxygen is also used along with the steam-reforming reaction to oxidize the methane into hydrogen. Overall, less heat and water are required. Carbon dioxide can also be captured from the ATR process, and this is more easily done than for SMRs.
Electrolysis
Water Electrolysis is fundamentally the splitting of water into hydrogen and oxygen. Electrolysis is a well-established technology and can be combined with renewable sources of electricity to produce hydrogen that does not directly require any hydrocarbon-based fuels. The reaction for water electrolysis is the exact opposite of combusting hydrogen. The main drawback of water electrolysis is the large amount of energy needed to split the water. If the energy is not derived from renewables, it will still be tied to carbon emissions. Electrolysis requires significant cooling, which is typically from evaporative cooling [2]. In addition, the process water for electrolysis must be of a high quality. Depending on the raw water quality, treatment can be an expensive and water intensive process.
Pyrolysis
Methane pyrolysis is the thermal decomposition, or breaking down, of methane using energy. Methane is split directly into hydrogen and carbon. Because solid carbon (C) is the only byproduct and is more easily manageable than CO2, proponents of pyrolysis argue it is a cleaner alternative for producing hydrogen, especially if renewable electricity is used to generate the heat needed for pyrolysis. While water is not a direct input, water may be required for cooling and catalyst reformation depending on the specific methane pyrolysis technology.
Table 1: Summary of theoretical vs actual water intensity of different hydrogen production technologies (WaterSMART Solutions Ltd., 2023).
| Technology | Litres of water consumed per kg of hydrogen produced | % of proposed hydrogen production in Alberta as of 2023 | |
| Theoretical | Actual | ||
| ATR | 3.9 | 4.8 – 21.7 | 69% |
| SMR | 4.5 | 5.5 – 25.0 | 9% |
| Electrolysis | 9 | 10 – 45.0 | 22% |
| Pyrolysis | 0 | 1.0 – 16.3 | 1% |
These processes are complex, and it is difficult to estimate the exact water requirements of proposed hydrogen facilities. Therefore, it is important that hydrogen project developers perform detailed analyses early in the planning stages to determine their water demands and the water available within the watersheds where they wish to operate.
Comparing Water Supply to Demand
Depending on where hydrogen facilities are built and which production technology is used, new hydrogen production could have varying impacts on the local watershed and could face different levels of risk in terms of water shortage. Water is a local issue, and it cannot easily be transferred between major watersheds under Alberta’s regulatory system. In Alberta, 80% of the freshwater is in the North, while 80% of the population lives in the South. Even if the regulations changed, the cost would likely be too great to make transportation between basins feasible.
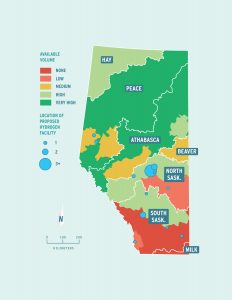
Figure 3: Heat map of Alberta, in terms of water availability, before new Hydrogen production facilities begin operations.
As you can see in Figure 3 above, many of the watersheds in which new hydrogen production is proposed already have limited water available for new uses. Some locations, such as in the South Saskatchewan, new water licenses cannot be applied for because the available water has already been allocated. As Figure 4 below shows, in a dry year, basins such as the North Saskatchewan, could become stressed due to the water demand from new hydrogen facilities.
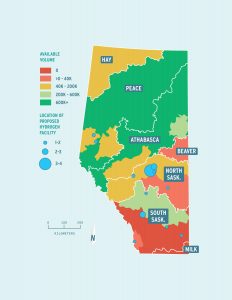
Figure 4: Heat map of Alberta, in terms of water availability, after new Hydrogen production facilities begin operations.
Climate Change Impacts
Temperature and precipitation trends demonstrate that measurable changes are already being experienced in Alberta (University of Lethbridge , 2020). For example, between 1951 and 2017 data shows that average winter temperatures in the province have already warmed 4 – 5 °C in southern Alberta and 6 – 7 °C in northern Alberta (University of Lethbridge , 2020). Continuing changes in both temperature and precipitation are driving changes in water availability across the province.
Overall, the temperature in Alberta is expected to increase. Particularly important from a hydrology perspective is that winter temperatures are projected to increase more than summer and fall temperatures, especially in the northern part of the province (WaterSMART Solutions Ltd., 2020). Increasing winter temperatures may mean more winter precipitation falls as rain, spring snowmelt occurs earlier, and snow will intermittently melt during the winter. These changes are likely to impact seasonal water availability patterns. Warmer temperatures are also projected in the summer, which will increase the rate of evaporation and evapotranspiration and may consequently reduce the available surface water and soil moisture (WaterSMART Solutions Ltd., 2020). Simultaneously, higher ambient temperatures are likely to increase the demand for water from facilities using evaporative cooling, potentially exacerbating warm-weather water availability challenges.
The water supply risks associated with climate change are implicitly considered within this research.
Conclusion
Although new hydrogen production, and its associated water consumption, may strain existing water supplies in some parts of Alberta, it must be noted that hydrogen production itself is not an inherent threat to Alberta’s water. Other new water demands associated with municipal, agricultural, and industrial development will also emerge in the future and could have the same water supply impacts as hydrogen in cases where the volumes demanded are the same. Additionally, producers that already have water licences secured do not necessarily face the same risks as those requiring new licences to operate in the future.
Whenever a new demand is placed on a finite resource, critical thought must be applied to fully understand the trade-offs and risks. In the case of new demand on Alberta’s water supply, especially on the scale of the proposed hydrogen production in the southern basins, water may be a limiting factor for production. The new demands could also limit the opportunity to support other water uses in the future. In the face of uncertainty surrounding climate change and changing precipitation patterns, our shared and finite water resources must be strategically managed to ensure Alberta’s people, economy, and environment are well positioned for the future.
Sources
[i] Government of Alberta. (2023, April 19). Emissions Reduction and Energy Development Plan. Retrieved from https://www.alberta.ca/emissions-reduction-and-energy-development-plan
[ii] Lampert, D. J., Cai, H., & Elgowainy, A. (2016, 01 12). Wells to wheels: water consumption for transportation fuels in the United States. Retrieved from https://www.osti.gov/biblio/1392949
[iii] University of Lethbridge . (2020, January 6). Interactive website shows Albertans how the climate is changing in their backyard. Retrieved from https://www.ulethbridge.ca/unews/article/interactive-website-shows-albertans-how-climate-changing-their-backyard#.XhNj5-t7l0A
[iv] WaterSMART Solutions Ltd. (2020). Appendix B: Hydrology Baseline Summary Report, appended to the Prairies and Land Management Strategy.
[v] WaterSMART Solutions Ltd. (2023, June 9). Study of Water Impacts of Hydrogen Development in Alberta . Retrieved from https://watersmartsolutions.ca/knowledge-base/study-of-water-impacts-of-hydrogen-development-in-alberta-2023/
ED’s Corner: Flood Anniversaries
June is the anniversary month of Alberta’s most expensive flood.
Back in 2013, there were two major floods in Canada: Southern Alberta and Toronto [i]. The bigger was the Southern Alberta flood which ended up displacing some 125,000 people, claimed 5 lives, cost approximately $6 billion (estimates vary) and affected some 55,000 square kilometres [ii]. At the time, it was Canada’s most expensive natural-hazard disaster but that title, sadly, quickly passed to another Alberta event three years later. But that, as the saying goes, is a story for another time.
Leading up to June 2013, there was concern that the year would be a dry year with the inevitable concerns for Alberta and downstream irrigation. However, in June, heavy rainfall fell in the headwaters of many rivers including the Bow, Elbow, Highwood, Little Bow, Sheep and South Saskatchewan leading to Alberta’s first Provincial State of Emergency being declared along with more than 30 community States of Emergency.
There has been much coverage of the flood and the subsequent response, recovery, mitigation and preparedness efforts – simply Google “Alberta 2013 flood” – I found 8.3 million results. (Also, and not to toot our own horn too loudly, the WaterPortal extensively covered the 2013 flood.) So, I have no intention of paddling that creek again. However, I think it worth noting that, ten years, hundreds of millions of dollars and much personal trauma later, the work to address the 2013 flood and to reduce the vulnerability to the next flood is still not done. All affected communities have worked since 2013 to reduce their vulnerability. Think of all the work that Calgary [iii] or High River [iv] have completed to name just two of the affected communities. There has also been considerable work by the Provincial [v] and Federal Governments.
All this work is not just driven by the floods of 2013 and the many subsequent floods [see vi for an enlightening but outdated list]. It is also driven by the certainty that there will be more floods in the future. Nature has conclusively demonstrated to us that far too many of our homes and far too much of our infrastructure is deeply vulnerable to current extreme precipitation events. Let alone what the climate scientists are forecasting with respect to changing precipitation patterns.
So, what to do if you are exposed to flooding? (And remember, flooding is not only the result of overflowing rivers: you may also be vulnerable to stormwater flooding or unusually high lake or sea levels.)
Work continues at the Federal, provincial and local government levels (e.g. mapping, relocation, defence). This work needs to continue. However, most of us, as private citizens, have little opportunity to materially affect some of this work. That said, there is always the option to better prepare on a personal level. The work of organisations such as Partners for Action’s FloodSMART Canada web site, the Intact Centre on Climate Adaptation or the Canadian Red Cross are aimed at helping individuals understand and reduce their flood risk. There are also the various government (e.g. Alberta, Nova Scotia, Ontario, Canada) and local authority (e.g. Calgary, Surrey B.C., Yellowknife) emergency preparedness sites. In other words, there is no shortage of information sources out there.
If you are one of the minority who are vulnerable to flooding and have prepared – CONGRATULATIONS!
If you’re not sure, think on these:
- 20% of Canadian homes are at risk of flooding but most homeowners don’t know it [vii].
- A 1:100 flood (i.e. a flood size with a chance of being matched or exceeded 1% of the time) has a 26% (i.e. ~1:4) chance of happening over the life of a 30-year mortgage.
- 94% of Canadians living in designated flood-risk areas not aware of their flood risk [viii].
Let’s keep our homes (and ourselves) dry!
Update: 2023-06-20
It’s occurred to me that I wrote about the “preparedness” resources above. It’s difficult to do that without knowing the nature and extent of the hazard one is facing… Doh!
Sadly, a key criticism from many quarters has been the challenges of flood hazard maps. Either because they don’t exist, are outdated, are hard to find or hard to understand. I mentioned the federal government’s work on mapping above and some of that work is an explicit attempt to address some of the mapping gaps. However, different approaches have been adopted in different provinces. In Alberta and New Brunswick, for example, mapping happens at the provincial government level. In British Columbia, on the other hand, flood maps are the responsibility of the local authority [ix]. In Ontario, there is a third approach: the watershed Conservation Authorities are responsible for flood plain mapping [x].
So, I think the best advice I can give with regard to establishing the extent of your flood risk is to briefly search online and, failing that, start with your local authority’s emergency management people. They will probably be delighted in your interest and happy to help.
Sources
[i] CBC, 2013, Alberta flooding top weather story of 2013. https://www.cbc.ca/news/world/alberta-flooding-top-weather-story-of-2013-1.2470102. Accessed 2023-06-19.
[ii] MNP, 2015, Review and Analysis of the Government of Alberta’s Response to and Recovery from 2013 Floods. https://open.alberta.ca/dataset/48bd39ee-2a5a-4846-944d-6004e0a8a498/resource/8404f003-1bde-49d9-a953-d37e0d671dac/download/2013-flood-response-report.pdf. Accessed 2023-06-19.
[iii] City of Calgary, n.d., Flood resiliency improvements since 2013. https://www.calgary.ca/water/flooding/flood-resiliency-improvements.html. Accessed 2023-06-19.
[iv] High River, 2023, Flood Protection/Mitigation Program Status for the Town of High River. https://highriver.civicweb.net/filepro/document/42040/2023-03-30_Insurance_Letter_FINAL.pdf. Accessed 2023-06-19.
[v] Government of Alberta, n.d., Flood mitigation. https://www.alberta.ca/flood-mitigation.aspx. Accessed 2023-06-19.
[vi] Public Safety Canada, n.d., Canadian Disaster Database. https://cdd.publicsafety.gc.ca/rslts-eng.aspx?cultureCode=en-Ca&boundingBox=&provinces=&eventTypes=%27FL%27&eventStartDate=&injured=&evacuated=&totalCost=&dead=&normalizedCostYear=1&dynamic=false. Accessed 2023-06-19.
[vii] Government of Canada, 2022, The risk of floods. https://www.canada.ca/en/campaign/flood-ready/know-the-risks/risk-floods.html. Accessed 2023-06-19.
[viii] Partners for Action, n.d., Canadian Voices on Flood Risk 2020. https://uwaterloo.ca/partners-for-action/past-projects/canadian-voices-flood-risk-2020. Accessed 2023-06-19.
[ix] Government of British Columbia, n.d., Floodplain mapping. https://www2.gov.bc.ca/gov/content/environment/air-land-water/water/drought-flooding-dikes-dams/integrated-flood-hazard-management/flood-hazard-land-use-management/floodplain-mapping. Accessed 2023-06-20.
[x] Conservation Ontario, n.d., Floodplain Mapping Ensures Public Safety and Prevents the Costly Impacts of Flooding and Erosion. https://conservationontario.ca/conservation-authorities/flood-erosion-management/floodplain-mapping/. Accessed 2023-06-20.
ED’s Corner: ESG – some thoughts on water management and corporate sustainability
We at the WaterPortal are passionate about water. We all know water affects everything. The irony is that it often disappears underground and, for many people is only noticed when there is too much, or too little. Or when its quality is compromised and is, directly or indirectly, affecting our health. At the WaterPortal, we strive to draw water into the foreground and to provide a credible, scientifically based and neutral source that our readers can tap into. (And also, it seems, a flood of damp water jokes and puns…)
As part of our mission, the WaterPortal offers “The Bog” (see, the jokes keep flowing) – an intermittent blog of entries on topics we think are topical and that might whet your curiosity on those topics. Typically, Bog authors to write on their speciality and share their expertise and opinions. This will be the first of an experimental new Bog series on topics which have caught the attention of WaterPortal staff for various reasons and which we think you might find interesting. We’re calling it “Ed’s corner” as we have a new Executive Director (get it?) and this is us dabbling on the shores of blog writing. Please give us feedback on whether you like it or hate it. Or suggest new topics for us to research and write about.
And so, to our first topic…
ESG – some thoughts on water management and corporate sustainability
What is “Environmental, Social and Governance” reporting?
ESG, or “Environmental, Social and Governance”, reporting is a growing trend in corporate governance reporting that includes a wide range of topics which may affect the corporate financial bottom line [i]. In in sign of the prevalence of Canadian ESG reporting, PwC Canada rated ESG reporting across Canada’s top 250 publicly traded companies [ii] in 2022. ESG reporting tends to go far beyond the traditional financial disclosure statements as the following definitions of the ESG components indicates [iii]:
- Environmental
Factors related to emissions, recycling, environmental footprint, environmental stewardship, biodiversity impacts, sustainability, etc. Considered most complex from a reporting perspective. - Social
Factors related to employee management, labour practices, safety of products and services, supply chain health & safety, access to their products and services by the disadvantaged, etc. - Governance
Shareholder rights, board diversity, executive compensation, corruption, etc.
Sounds onerous – why bother?
Essentially, ESG reporting ties into a broad movement towards greater sustainability and corporate transparency. While ESG predates them, the United Nations’ Sustainable Development Goals and the European Union’s Corporative Sustainability Directive [iv, v] are helping drive the movement. Here in Canada, there is a similar proposal from the Canadian Securities Administrator [vi] although more narrowly focused on climate-related reporting and greenhouse gases. There are other relevant entities which exert influence on Canadian sustainability assurance reporting [vii, viii]. It should be noted that ESG reporting is becoming politically contentious in the United States [ix] with some parties promoting active resistance to ESG.
Aside from the regulatory environment, there is also growing interest from investors who are starting to apply ESG-related criteria to their investment decisions and are expecting relevant disclosure from the corporations in which they are prepared to invest. The CDP’s 2022 Global Water Report “Riding the Wave” released in March 2023 [x], notes that investors controlling US$130 trillion are requesting the disclosure of corporate water information (p.6) and the numbers are growing (see Figure 1 below).
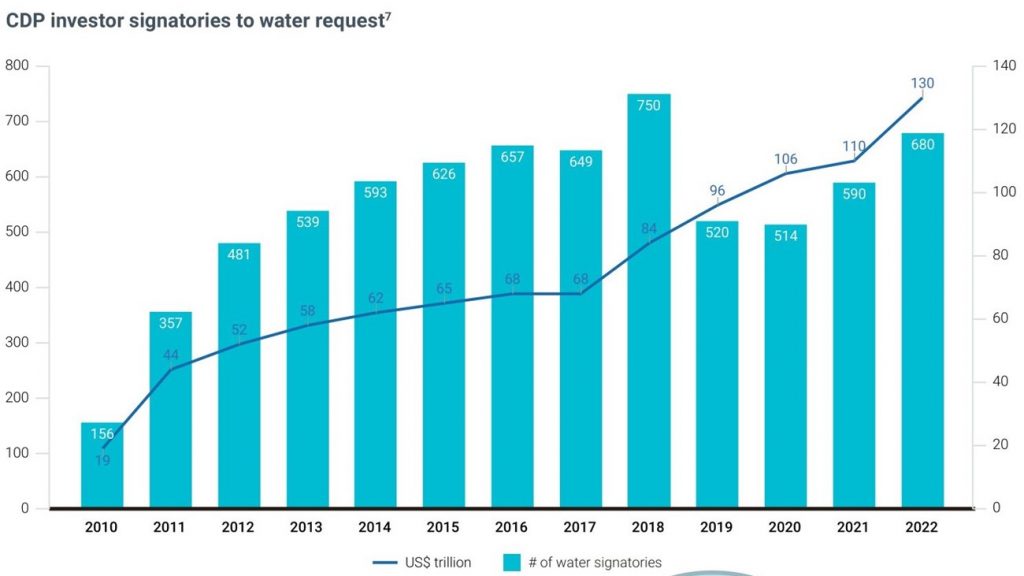
Figure 1: Trends of interested investors and their assets
What is the tie to water management?
Environment is the obvious ESG component for the reporting on water issues. In 2021, the World Economic Forum noted that water-focused ESG reporting frameworks were considered, in general, to be under-representing water-related risks and opportunities [xi] with relation to corporate performance. The article cited above calls for water risks to be considered of equal importance as climate risk while understanding that water risks are connected to, but independent of, climate risks.
A lauded exception is the Water Framework of the CDP (previously known as the Carbon Disclosure Project). The CDP is a global non-profit which specializes in environmental effect disclosures by companies and local, regional, and public authorities. The CDP has produced several water-focused reports over the last few years based on the growing number of companies responding to CDP questionnaires. Some of these reports are foundational to the discussion below.
What’s the benefit of reporting on organizational water use?
Water availability and quality are growing issues for organizations. Aside from obvious industries such as agriculture, many industries are starting to realize:
1) how dependent they are on water, and
2) that the dependency should no longer be taken for granted.
In Canada, Statistics Canada (StatsCan) reports on Canadian water usage: in 2019 [xii], 8% went to household use, 92% went to industrial use. (See figure 2 below.) While the StatsCan report makes no mention of eco-system services and issues such as environmental flow needs, that 92% use suggests that some moderate tweaks in industrial processes could provide significant benefits to both industry and the environment.
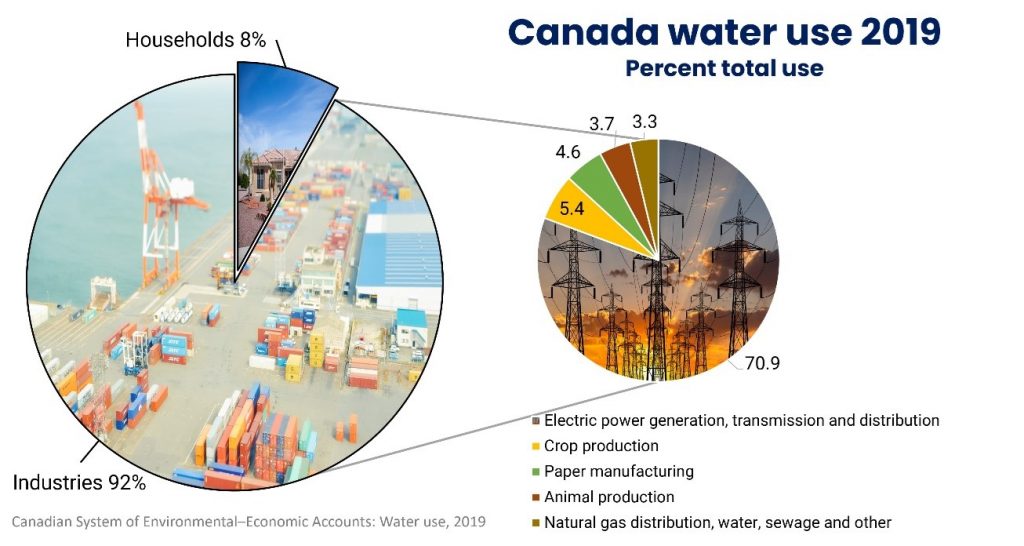
Figure 2: Canada’s water use in 2019 as per Statistics Canada, 2022.
The CDP’s 2023 “Riding the Wave” report notes that 3909 companies provided water-related data to the CDP in 2022 (out of 8477 asked). A 2022 CDP report, “High and dry” [xiii], details 4 case studies of major industrial operations being derailed by water issues. Perhaps most relevant for Canadians is the cancellation of the Keystone XL pipeline which, as per the CDP, was significantly driven by community concerns over freshwater contamination. The cancellation is thought to have cost the TC Energy corporation a cumulative CA$5 billion.
Similarly, Barrick Gold is estimated to have written off US$7.5 billion from the “asset stranding” of the Chilean portion of the Pascua-Lama gold mine as a result of significant water-related concerns. More generally, the CDP’s “High and dry” report indicates the prevalence of global corporate concern (Figure 3 below): 68% of the 1,112 survey respondents expect an estimated maximum impact of US$225 billion from the six water-related risk factors identified in the chart below.
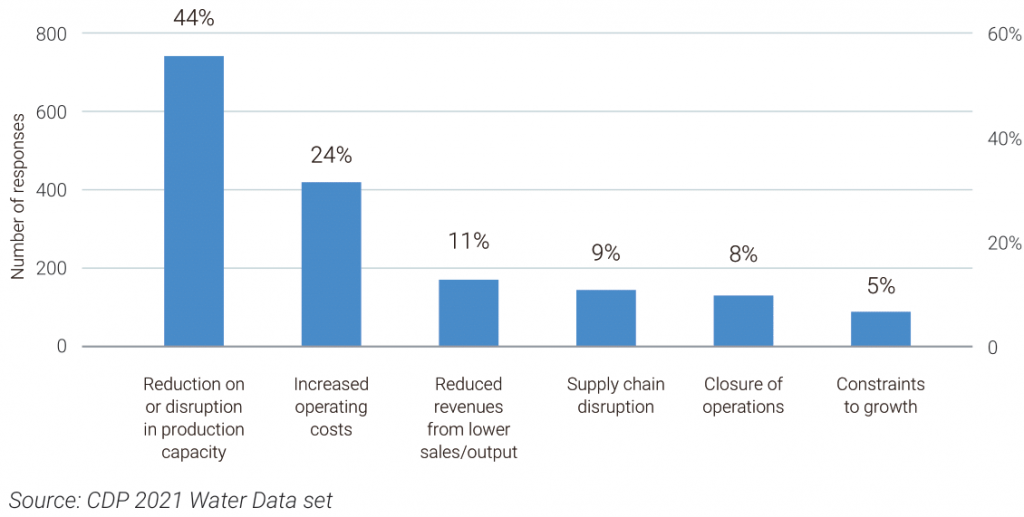
Figure 3: Water-related risk drivers reported by survey respondents
Aside from the “sticks” mentioned above, there are also “carrots”. The CDP’s 2023 “Riding the Wave” reports some key incentives (p.4) identified by their reporting corporations:
- “4x more opportunities” for those firms integrating water into long term business and financial planning.
- The identification of a cumulative US$436 billion in water-related business opportunities.
More specifically, 1,729 respondents to the CDP survey reported identifying water-related business opportunities arising from potentially being able to access new markets, increase production capacity, become more resilient, gain competitive advantage and better access to credit (p.12, see Figure 4 below). It is notable that the StatsCan report cited above notes that 2019’s “intensity of industrial water use” was 16.6 cubic metres per CA$1000 of GDP which represents a 6.3% decrease (i.e. improvement from the perspective of water conservation) over 2017. No cause for the decrease is cited beyond a comment that the largest decreases occurred in agrifood production and that 2019 had high levels of precipitation. (Ed’s comment: it would be nice to think that this decrease was also connected to greater efficiency of use – we’ll have to see the next report to see whether a trend is starting. Household use has been trending down since 2009 although 2019 saw a slight increase over 2017 but below the population growth rate [xiv].)
Figure 4: Number and value of water-related opportunities identified by CDP respondents
Summary
As a sweeping summary statement: water reporting under ESG can trigger the corporate attention which reveals both threats (supply, social license) and opportunities (vulnerability reduction, increased efficiency, competitive advantage). Further, explicit attention to water and sustainability may support corporate efforts in building relationships with the communities in which they operate, their investors and their customers. And, while there may not be a direct causal link, it is to be hoped that the greater awareness engendered by ESG reporting will also result in improved water-related environmental outcomes.
Sources
[ii] PwC, 2022, PwC Canada study highlights continued shortcomings in ESG reporting across top 250 public companies. https://www.pwc.com/ca/en/today-s-issues/environmental-social-and-governance/esg-reporting-insights.html. Accessed 2023-05-31.
[iii] Deloitte, n.d., #1: What is ESG? https://www2.deloitte.com/ce/en/pages/global-business-services/articles/esg-explained-1-what-is-esg.html. Accessed 2023-05-23.
[iv] Menier, T., Mishkin, S.H. et al, 2023, EU Finalizes ESG Reporting Rules with International Impacts. https://corpgov.law.harvard.edu/2023/01/30/eu-finalizes-esg-reporting-rules-with-international-impacts/. Accessed 2023-05-23.
[v] Wollmert, P. & Hobbs, A., 2022, How the EU’s new sustainability directive is becoming a game changer. https://www.ey.com/en_gl/assurance/how-the-eu-s-new-sustainability-directive-is-becoming-a-game-changer. Accessed 2023-05-24.
[vi] Canadian Securities Administrator, 2021, Consultation Climate-related Disclosure Update and CSA Notice and Request for Comment Proposed National Instrument 51-107 Disclosure of Climate-related Matters. https://www.osc.ca/sites/default/files/2021-10/csa_20211018_51-107_disclosure-update.pdf. Accessed 2023-05-23.
[vii] Yacyshyn, A., 2022, Understanding the changing landscape of sustainability assurance in Canada. https://www.cpacanada.ca/en/business-and-accounting-resources/audit-and-assurance/blog/2022/march/changing-landscape-sustainability-assurance. Accessed 2023-05-23.
[viii] Lamb, C. et al, 2022, Setting the high-water mark for mandatory disclosure. https://cdn.cdp.net/cdp-production/cms/policy_briefings/documents/000/006/409/original/Setting_the_high_water_mark_for_mandatory_disclosure.pdf?1660576398. Accessed 2023-05-23.
[ix] Malone, E., Holland, E. et al, 2023, ESG Battlegrounds: How the States Are Shaping the Regulatory Landscape in the U.S. https://corpgov.law.harvard.edu/2023/03/11/esg-battlegrounds-how-the-states-are-shaping-the-regulatory-landscape-in-the-u-s/. Accessed 2023-05-23.
[x] CDP, 2023, Riding the Wave: How the private sector is seizing opportunities to accelerate progress on water security. https://www.cdp.net/en/research/global-reports/global-water-report-2022. Accessed 2023-05-23.
[xi] Sarni, W., 2021, We need to rethink ESG to ensure access to water and sanitation for all. https://www.weforum.org/agenda/2021/08/rethink-esg-to-ensure-access-to-water-and-sanitation-for-all/. Accessed 2023-05-23.
[xii] Statistics Canada, 2022, Physical flow accounts: Water Use, 2019. https://www150.statcan.gc.ca/n1/pub/11-627-m/11-627-m2022087-eng.htm. Accessed 2023-06-01.
[xiii] CDP, 2022, High and dry: how water issues are stranding assets. https://www.cdp.net/en/research/global-reports/high-and-dry-how-water-issues-are-stranding-assets. Accessed 2023-05-23.
[xiv] Statistics Canada, 2023, Table 38-10-0250-01 Physical flow account for water use (x 1,000). https://www150.statcan.gc.ca/t1/tbl1/en/tv.action?pid=3810025001&cubeTimeFrame.startYear=2009&cubeTimeFrame.endYear=2019&referencePeriods=20090101%2C20190101. Accessed 2023-06-01.
World Water Day: Ways to celebrate, educate, and accelerate change
Every year on March 22, people around the world celebrate water by educating themselves on water-related issues both local and global. In honour of World Water Day, the Alberta WaterPortal Society is raising awareness for the importance of education to inspire action and accelerate change.
In 2022, the WaterPortal contributed to local water education by creating fun and easy-to-understand learning resources that are accessible to everyone, free on our website. A few of these new materials include:
- An animated video series on water’s relationship to agriculture;
- An interactive story map showing where and how water is being used, recycled, and conserved across Alberta;
- A digital series on water connections in action.
But why is learning about water so important? What can you do with a growing knowledge base on water? The United Nations’ World Water Day 2023 animation puts this into perspective through the ancient tale of the hummingbird and the great fire. The story tells of a hummingbird who brings water one droplet at a time to help douse a fire that is ravaging its forest. When asked why she works so hard with so little to give, she says she is doing what she can.
According to the UN, we are currently facing a global water and sanitation crisis. Becoming more informed on water issues in your local and global environment can help you understand the change that you are capable of making right now. If everyone carries water one droplet at a time, we can accelerate change on a global scale.
What can you do beyond educating yourself? Like the hummingbird, a little action can go a long way. Check out the UN’s Lazy Person’s Guide to Saving the World to learn about water and environmental conservation tactics that you can easily employ as early as today! Head over to our Water Connections page to see more of what the WaterPortal has been doing this last year to enhance water education in Alberta. Or visit the World Water Day website for more information on what is being done globally to get back on track for the goal of bringing water and sanitation to the world by 2030.
Key findings from the United Nations World Water Development Report 2023
Education spurs action. Every year, the UN releases a new report on World Water Day to help the global population and its leaders understand what is currently being done, and what remains to be accomplished, in order to protect, conserve, and adequately distribute this amazing resource. Read on for a few key findings from this year’s report, The United Nations World Water Development Report 2023: partnerships and cooperation for water
Water scarcity
This year’s report focuses strongly on the progress, or lack thereof, toward Sustainable Development Goal 6: to “ensure availability and sustainable management of water and sanitation for all.” According to the UN, water demand continues to increase as populations expand, but supply is becoming more uncertain. Progress toward Goal 6 needs to be approximately four times faster to meet the promise by 2030.
Water quality
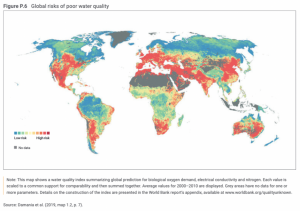
Poor water quality is a large contributor to the lack of progress made toward Goal 6, but there is limited water quality data available on a global scale. The following figure from the report demonstrates the predictions of poor water quality risks across the world.
The water nexus
The Water-Energy-Food-Ecosystem (WEFE) nexus provides an approach to understanding the complex connections within water use, which can help our leaders understand how to better manage water to address the issue of water scarcity. The Alberta WaterPortal Society’s Water Nexus page features an interactive game, quick animated videos, and even a nexus simulator to help you understand the water nexus in easy and engaging ways. The more you know, the more you can do to help.
Climate change and water pollution
With a changing climate, water pollution is now a growing concern. According to the report, the rate of degradation and loss of biodiversity is highest in freshwater ecosystems. Partnerships that bring together downstream users to invest in upstream habitat protection can improve water quality and generate long-term benefits. Policy-makers need to better understand the role that water and sanitation can play in climate change mitigation, in order to better protect both environmental and human health.
Water quality and citizen science
While the UN report highlights some critical problems, it also provides examples of encouraging innovations and ideas that can help address these issues. Awareness that scientific knowledge needs to be better integrated with the inclusion of other knowledge bases, such as local and indigenous knowledge, is increasing. Citizen science, which uses public participation to enhance social inclusion, is on the rise in water projects, thanks to evolving technologies. For example, Debris Tracker is a citizen science project that operates globally to track the status of plastic debris from upstream catchments down through to oceans. The Earthwatch FreshWater Watch is another citizen science project that mobilizes individuals around the globe to collect and analyze the water samples necessary to provide data for improving water quality.

Accelerating change
The best way to accelerate change in the world of water is through education and collaboration. Partnerships and cooperation between water and climate stakeholders can create additional benefits to freshwater ecosystems and those most impacted by water scarcity and extreme weather events augmented by climate change. From the public to the policy makers, understanding the connections between water and the world can be a major driver for change. Recognizing our part in protecting this resource is an essential first step. Water connects all of us. So let’s take care of it on a global scale.
DataStream: Collaboration is key for sharing water data
By Mary Kruk, Water Data Specialist, DataStream
 As of 2020, the water quality in 60 per cent of Canadian watersheds remains unknown. Although diverse groups across the country monitor their local waterways and collect a great deal of water data, this information is often not available or easily comparable for various reasons, including if the information is stored using different formats.
This lack of easily accessible water data is a major problem. It makes managing Canadian watersheds, which make up 20 per cent of the world’s freshwater, much more difficult, as creating good public policy depends on the right data to inform decisions.
Eight years ago: A recollection of the 2013 floods in southern Alberta
Eight years ago, one of the most devastating floods in Calgary’s history carved its way through southern Alberta, displacing thousands of people from their homes. One such Alberta resident, Victoria Pleavin of WaterSMART Solutions, now recalls her personal experience on the eighth anniversary of the 2013 southern Alberta floods.
“In June 2013 I was living in Mission, Calgary, less than one block from the Elbow River,” Victoria recalls. “I remember the morning of June 20th seeing several pictures posted of extreme flooding happening upstream in Canmore and thinking, ‘that is coming my way.’”