PUBLISHED: 13 August 2012

Annual and Seasonal Flow Trends

Annual and Seasonal Flow Trends

To allow for the most detailed analysis possible, the trend analysis was based on a 30-year time period (1971-2000). In order to confirm if the 1971-2000 period results in different trends than other time periods, the 1971-2000 trends were compared to trends covering the periods of 1912-2001, 1951-1980, 1961-1990, and 1970-2008.

From the trend comparison analysis it can be concluded that the application of the 1971-2000 period for trend analysis does not generally result in extremely negative trends, and rarely results in the highest positive trend. On the contrary, and especially in southern Alberta, the use of the 1971-2000 period results in rather too positive trends, especially when compared to longer time periods. Therefore, using the 1971-2000 trends can be interpreted as resulting in either average or under-estimating trends. Therefore, reported trends are more likely to be more negative than the long-term trends.


Summary of Alberta Streamflow Trends (1971 to 2000)

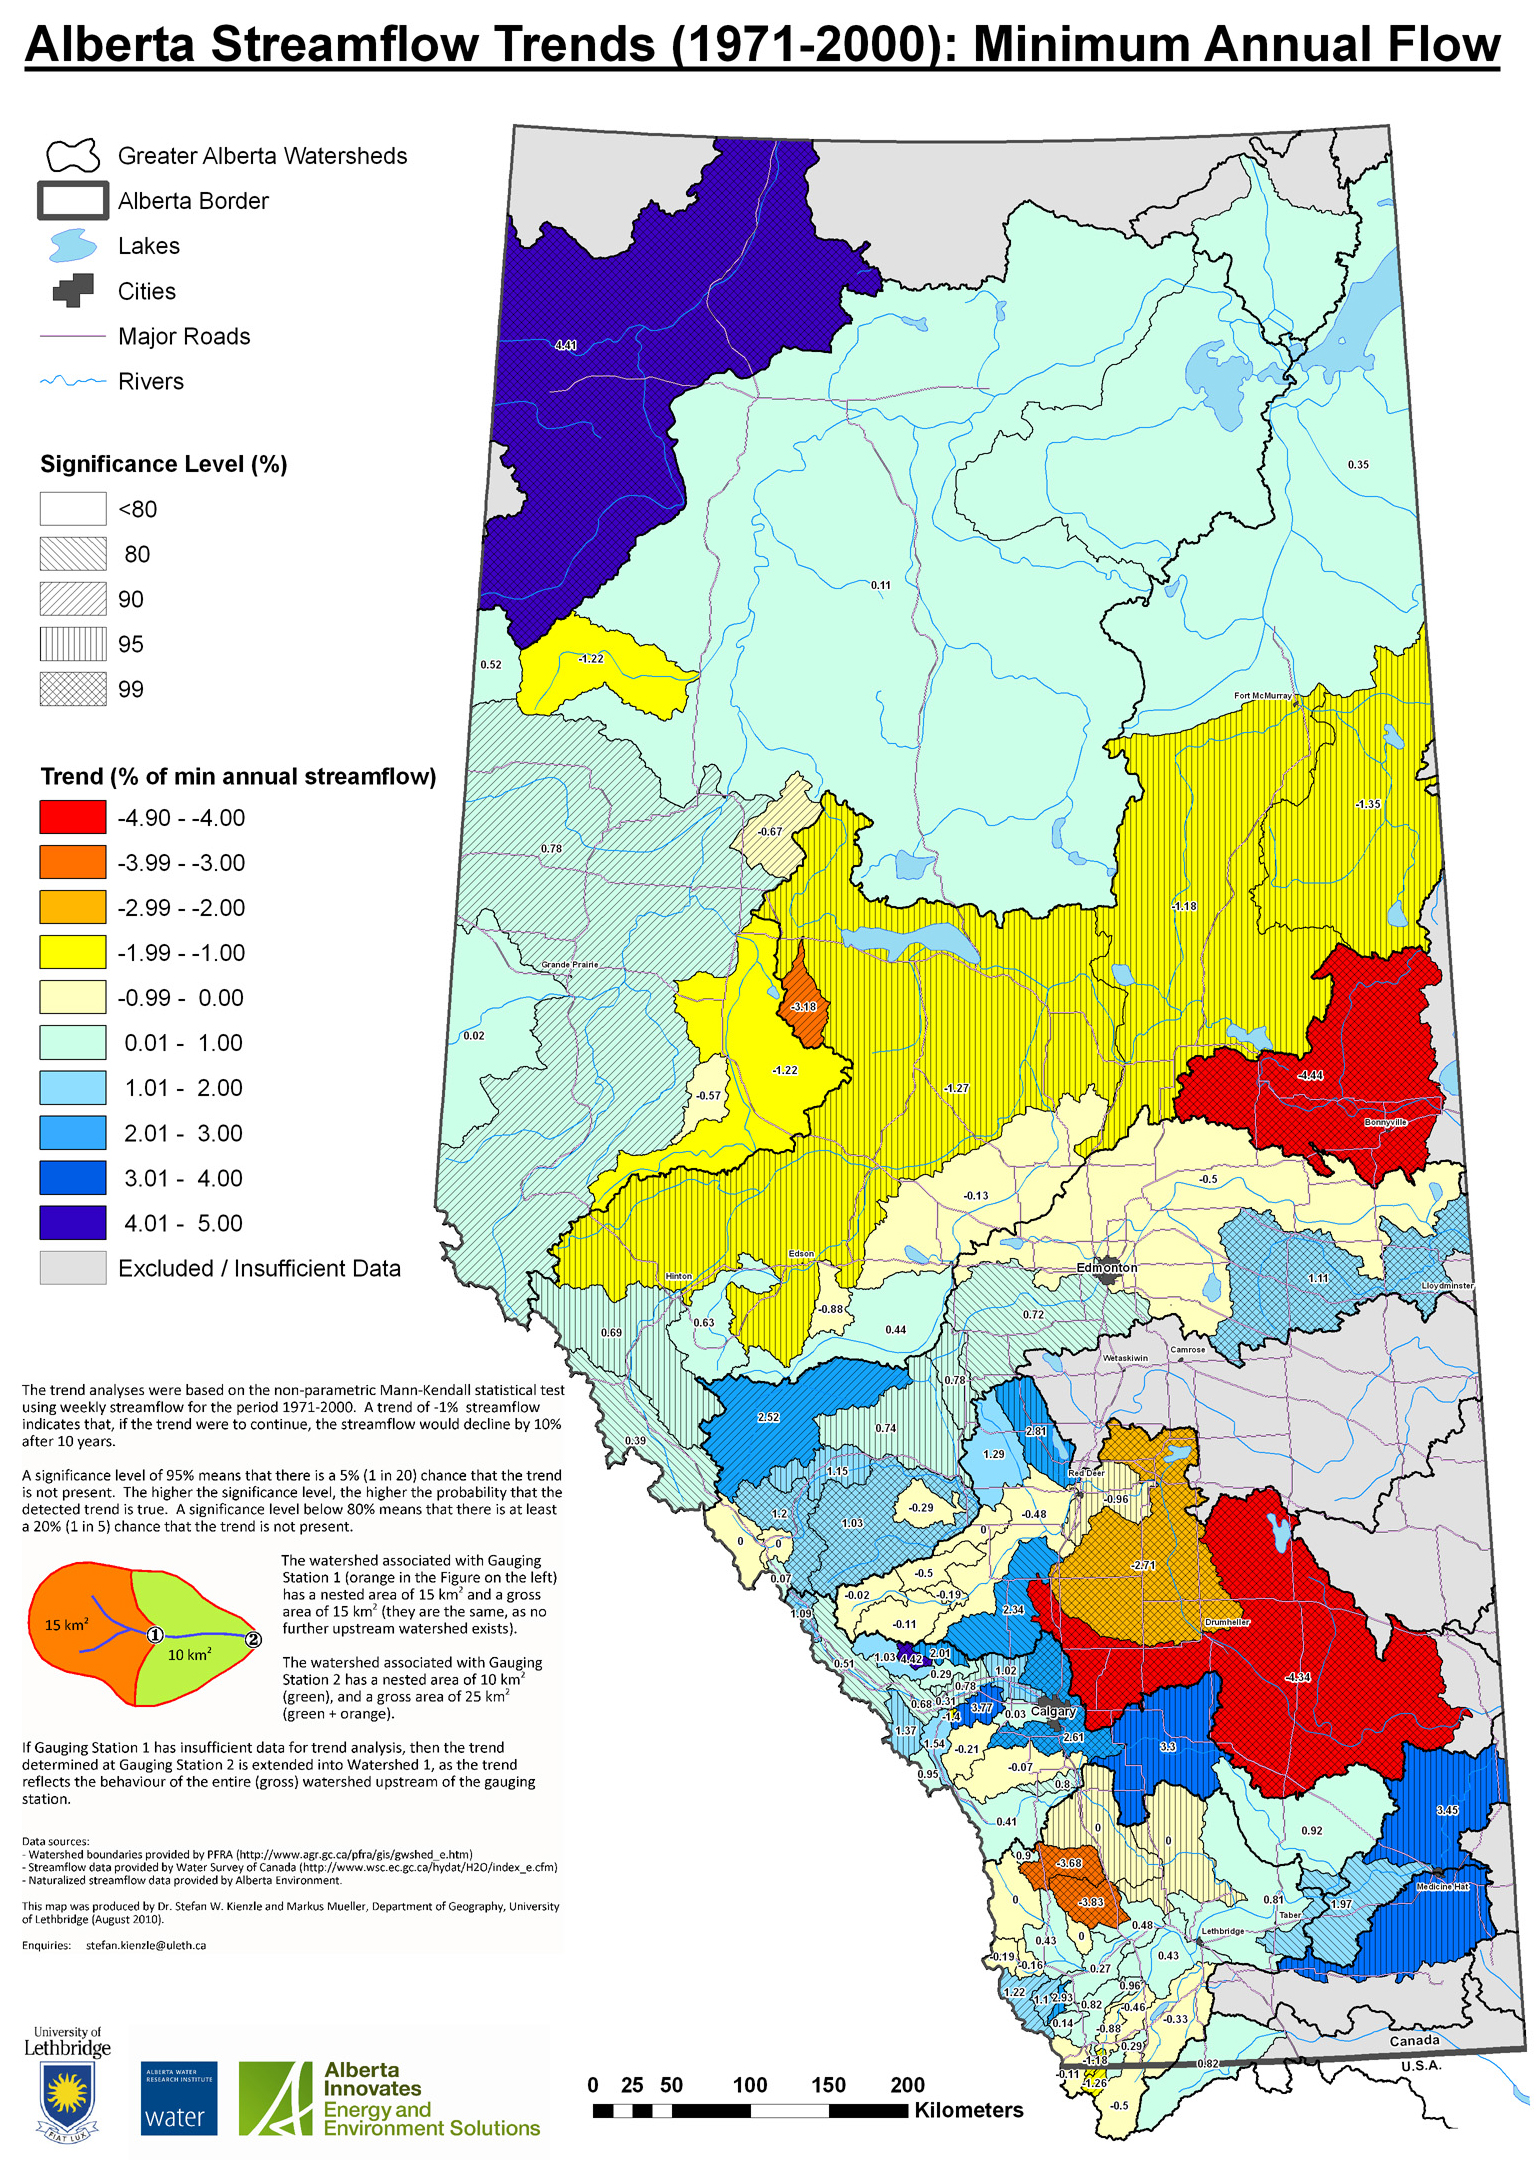
Out of 102 watersheds for which trend analyses could be carried out, 60 had negative trends in mean annual streamflow. 14 watersheds had a negative streamflow of over 1% per year, which means that after 10 years, over 10% less streamflow would be available if the detected trends were to continue.


Annual Streamflows

Alberta Water Yield Map Mean Annual Flows

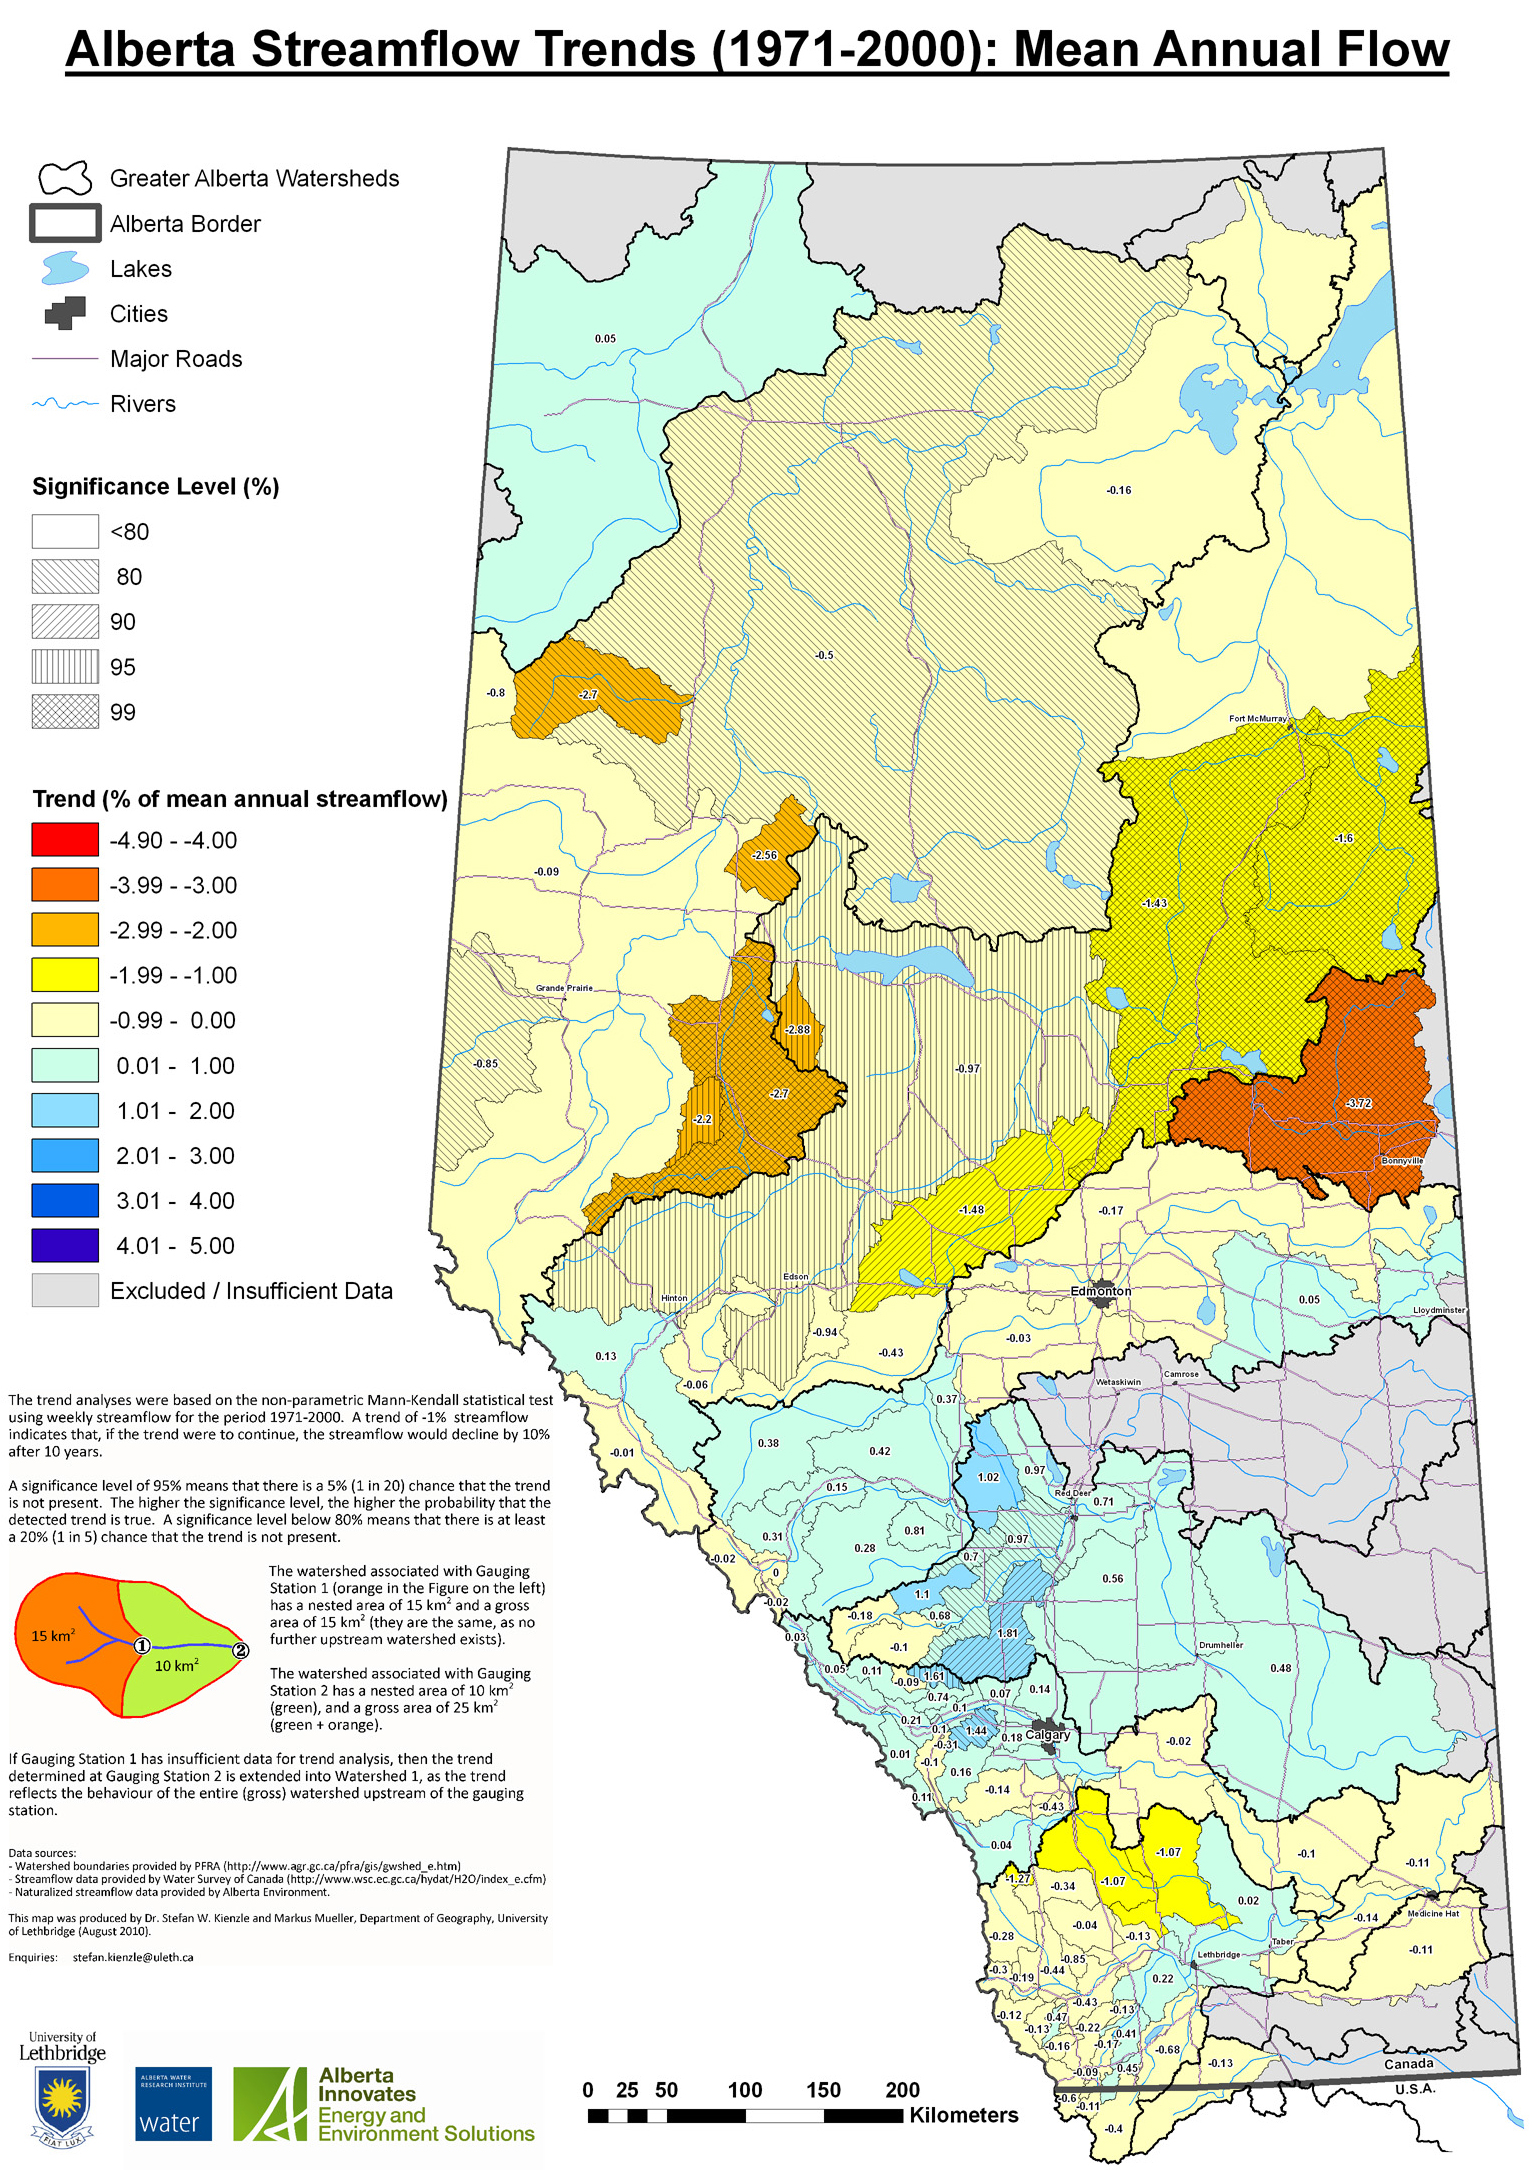
The mean annual flow is declining in southern Alberta (Oldman, Milk, lower Bow) as well as northern Alberta (lower North Saskatchewan, Athabasca, Peace) and increasing in western-central Alberta (upper Bow, Red Deer, upper North Saskatchewan). However, the only watersheds that exhibit highly significant trends are the Athabasca and the Churchill Rivers, both with the strongest negative trends, and the central Peace River.


alberta trend minimum annual flow Minimum Annual Flows

As minimum flows are more sensitive to environmental changes, the trends are stronger in magnitude (both negative and positive trends). The spatial pattern across Alberta is not as clear as the mean annual trends, with many major watersheds having both strong positive and strong negative trends, most of which are also highly significant. Again, the Athabasca and Churchill Rivers stand out as rivers which have strong negative trends.


alberta trend max annual flowMaximum Annual Flows

The spatial pattern of the maximum annual flow is quite similar to the mean annual flow, with the Red Deer River having the strongest increase in maximum flows.

However, with the exception of the Peace River and the Churchill River, most maximum annual flow trends are not significant.


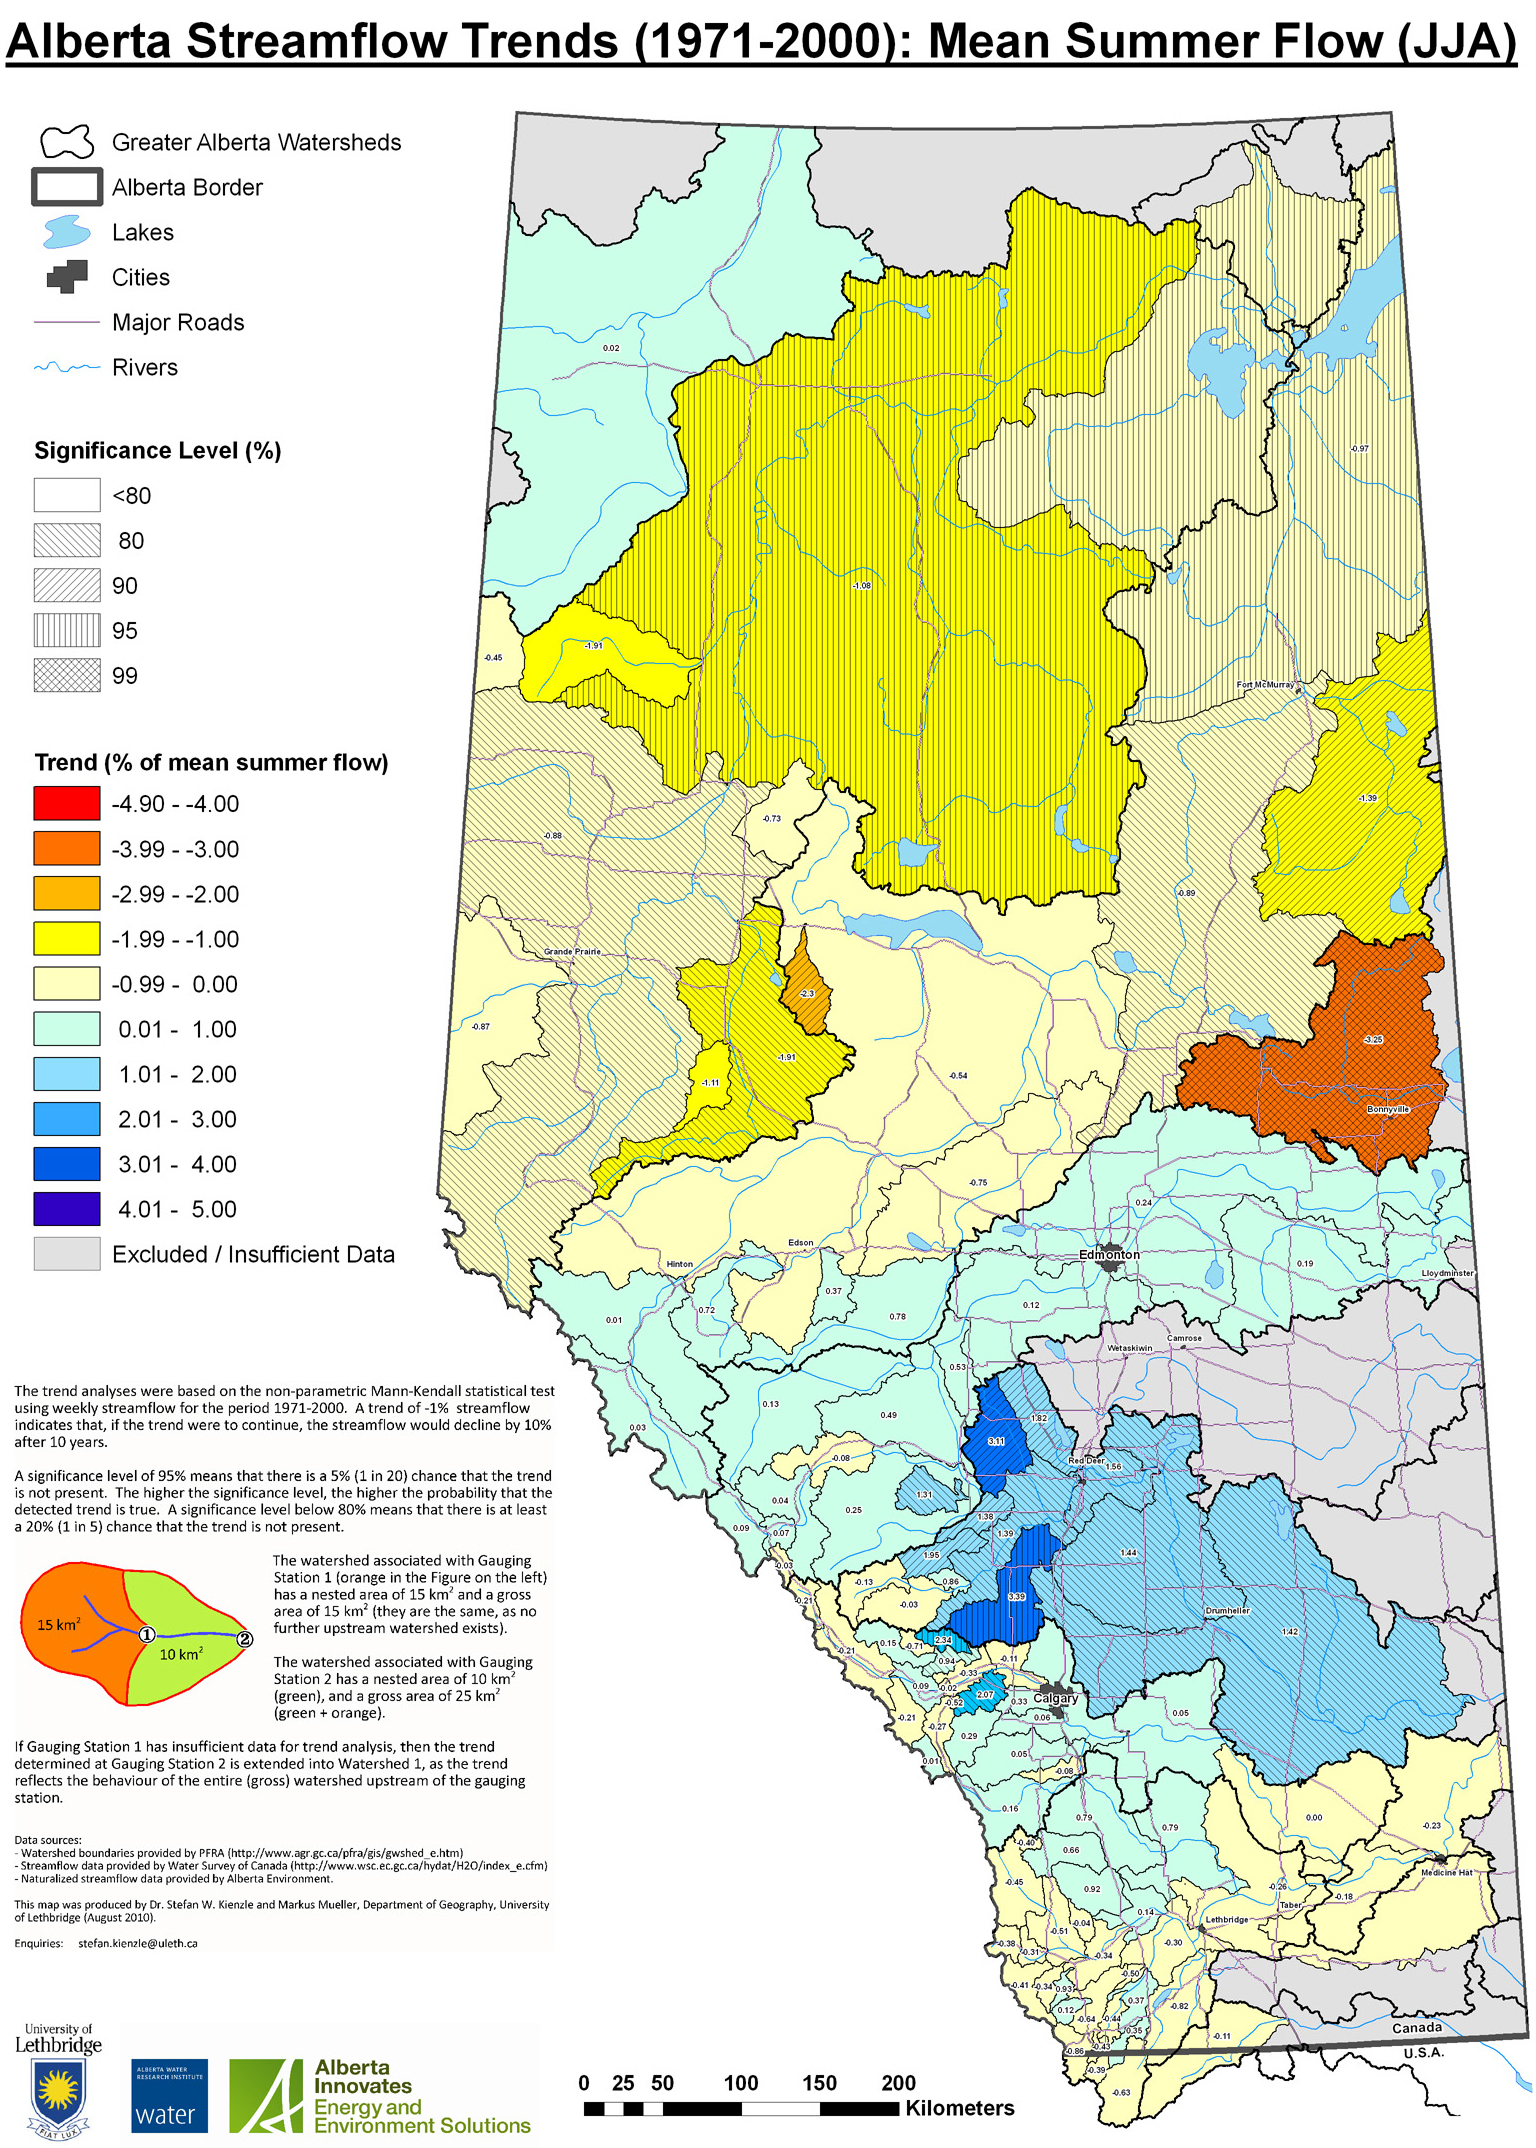
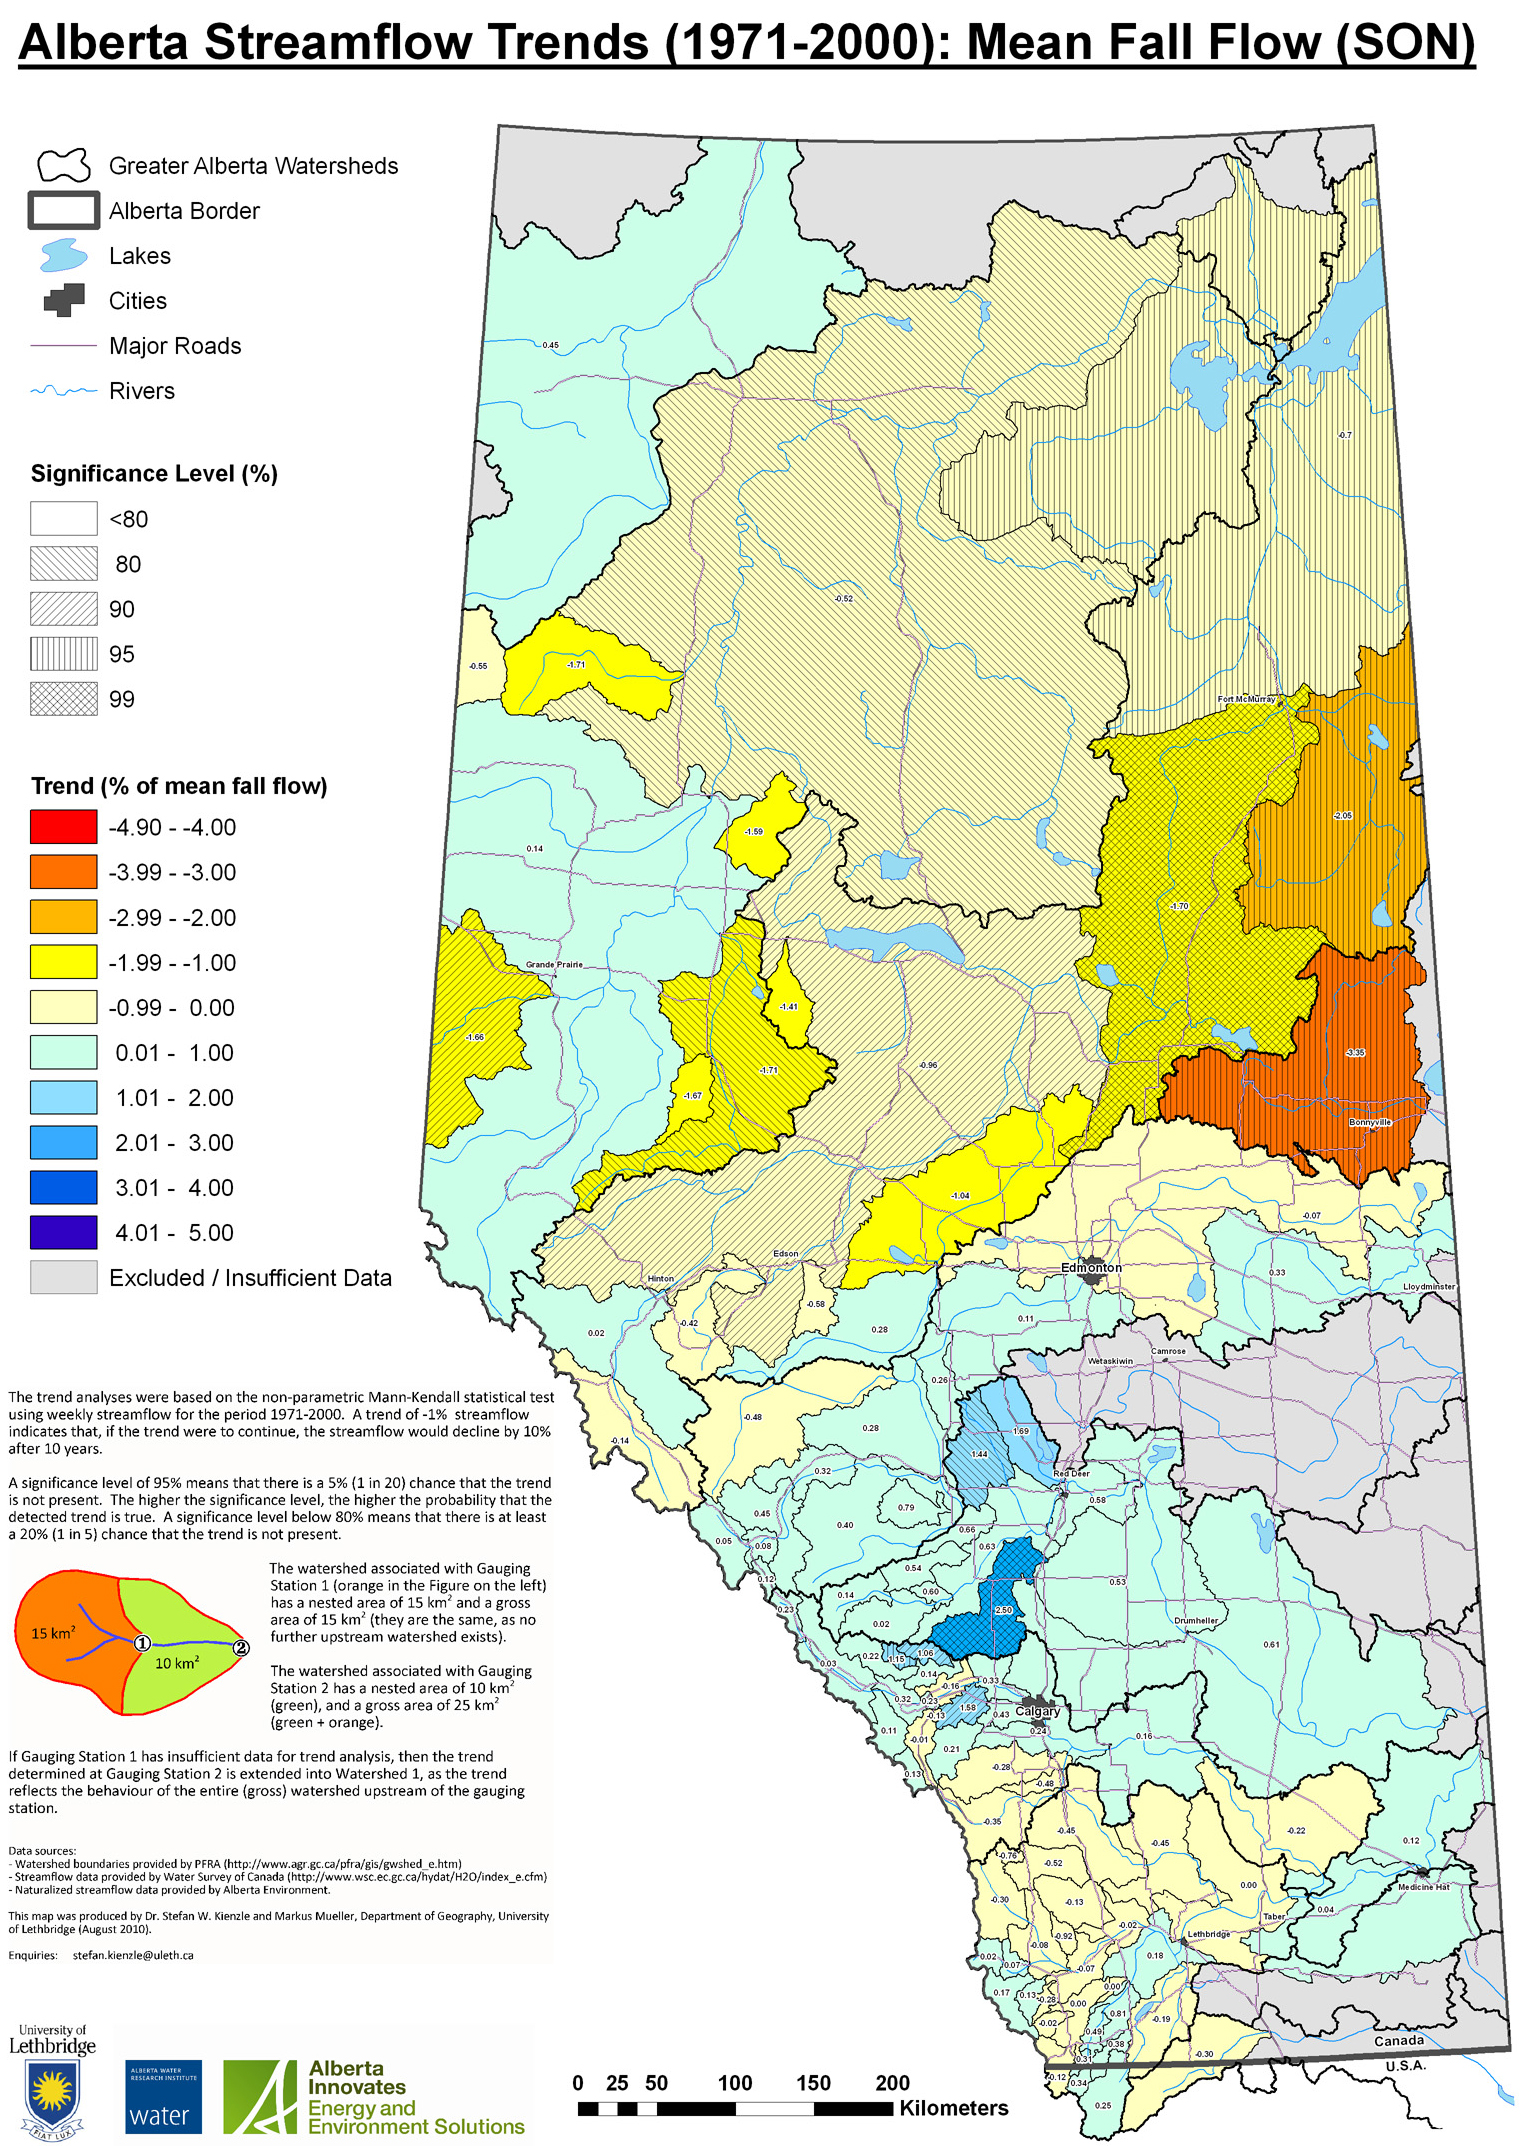
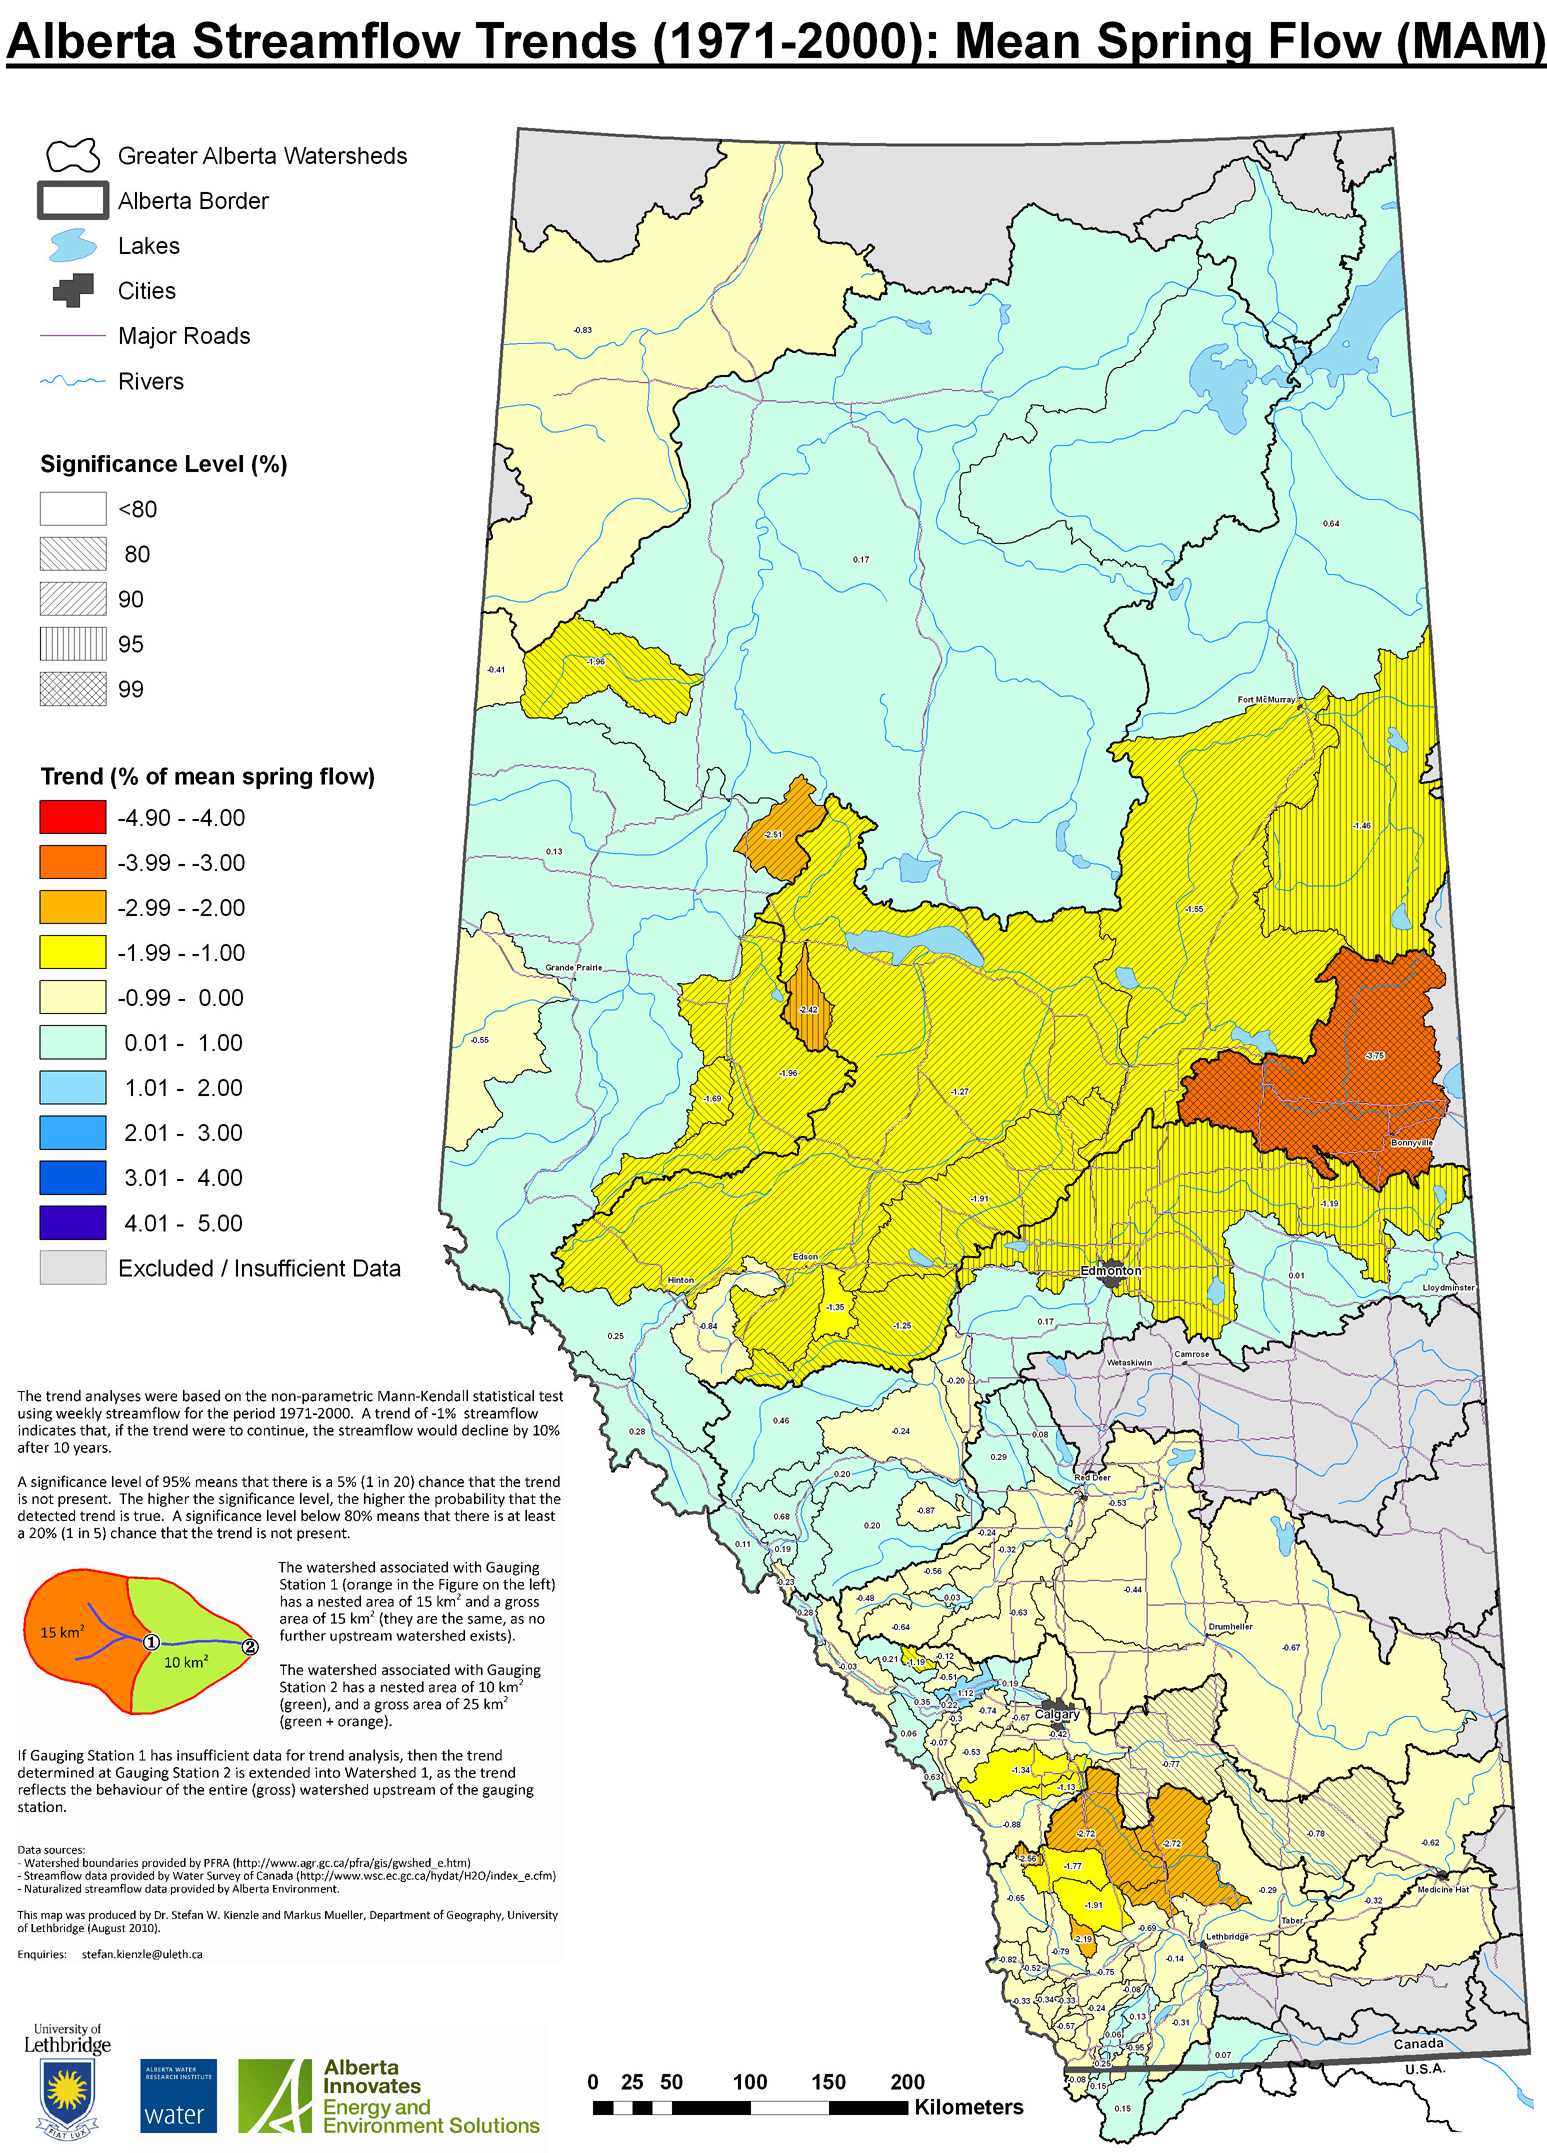
Seasonal Streamflows

Alberta trend mean winter flowWinter Flows

With few exceptions, such as large parts of the Athabasca River and the Churchill River, winter flows are increasing.

This can be explained by the recent increase in rainfall during winter, which is not stored, such as snow, and can run off to become streamflow.


Alberta spring flowSpring Flows

Spring flows are declining in southern Alberta, with the exception of the St. Mary watershed, which contributes about one quarter of the streamflow in the Oldman River watershed. Some headwaters in the Bow, as well as the upper North Saskatchewan River and most of the Peace River show an increase in spring streamflow. The Athabasca River and the Churchill River show a strong decline in spring streamflows.

Alberta trend summer flowSummer Flows

The spatial pattern across Alberta of summer flows is quite similar to the mean annual flow. Central Alberta exhibits increasing flows (central Bow, Red Deer, North Saskatchewan, upper Athabasca), while the rest is showing declining trends. Other than in some northern watersheds, most trends have a significance level of under 80%.


Alberta trend autumn flowAutumn Flows

With few exceptions, the autumn streamflow trends are quite similar to the summer streamflow trends.