Alberta’s Water Yield
Water Yield can be calculated by dividing the mean annual volume of streamflow that is produced in a nested watershed (expressed in cubic meters per year), by the area of the nested watershed (expressed in square kilometers).
| Water Yield = |
Mean annual volume of streamflow (produced in a nested watershed) |
The area of a nested watershed can be determined using the following approach:
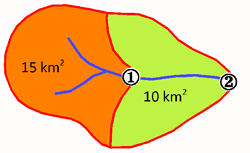
- The watershed associated with Station 1 (orange area in the Figure on the left) has a nested area of 15 km2 and a gross area of 15 km2 (they are the same, as no further upstream watershed exists).
- The watershed associated with Station 2 (green area in the Figure on the left) has a nested area of 10 km2 and a gross area of 25 km2 (sum of this green watershed and the upstream orange watershed).
The water yield can also be expressed in mm, as both precipitation and evaporation are typically expressed in mm. For example, a watershed with 1,000 mm annual precipitation, and an annual 40%, (i.e. 400 mm), water loss due to evaporation, would have a water yield of 600 mm per year.
A total of 287 watersheds in Alberta were analyzed for water yield. The water yields vary from negative values in 12 prairie watersheds, where more water enters the watershed than is flowing out (this is possible due to evaporation losses within the watershed), to values of over half a million m3 per km2 per year in 21 high altitude Rocky Mountain watersheds. The water yield in Alberta has a distinct spatial distribution, with three major areas.
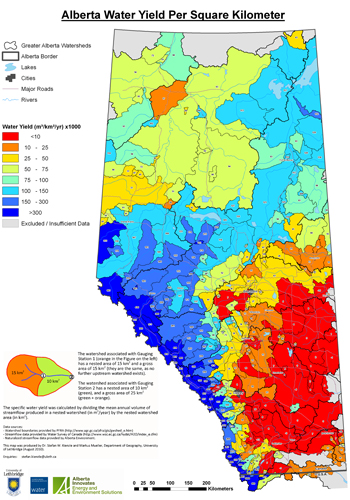
- The highest yields, over 300,000 cubic meters (per square kilometer per year), reflected as the dark blue regions on the map, are produced in the Rocky Mountains. Within the Rocky Mountains, Alberta’s south-west corner has the highest yields (also including the St. Mary’s watershed, which has its headwaters and highest yields in Montana of 640,000 cubic meters (per square kilometer per year). These high-yielding watersheds produce, on average, over half a million cubic meters (per square kilometer per year).
- The lowest water yields are produced in the prairies, reflected as the dark red regions on the map, where the combined effects of low annual precipitation and high evaporation losses result in very low (under 25,000 cubic meters (per square kilometer per year), and occasionally negative, water yields, averaging just under 10,000 cubic meters (per square kilometer per year).
- The third region is the in-between region, reflected as the yellow-gold regions on the map, and found mainly in central and northern Alberta (as well as between the high-yield and low-yield regions). Here, water yields range from 25,000-300,000 cubic meters (per square kilometer per year), with an average of just over 100,000 cubic meters (per square kilometer per year).
Summary of Water Yield analysis based on 287 watersheds across Alberta
|
|
Water Yield |
Water Yield |
Number of watersheds |
|
Average |
137,000 |
137 |
– |
|
Minimum |
-35,000 |
-35 |
– |
|
Maximum |
1,084,000 |
1,084 |
– |
|
Median |
64,000 |
64 |
– |
|
Low yield |
>25,000 |
>25 |
83 |
|
Medium yield |
25,000 – 300,000 |
25 – 300 |
164 |
|
High yield |
>300,000 |
>300 |
40 |
Percent Contribution of Major Watersheds
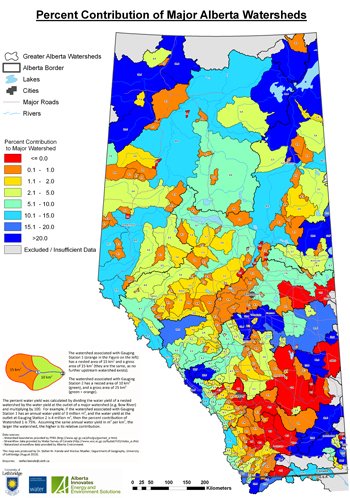
The second map shows what proportion of water yield within each of the major watersheds is produced where. This map is useful for water managers, as it provides insight into which are the most water producing watersheds.
The percent water yield is calculated by dividing the water yield of a nested watershed by the water yield at the outlet of a major watershed (eg: Bow River) and multiplying by 100. For example, if the watershed at Station 1 has an annual water yield of 3 million cubic meters, and the water yield at the outlet at Station 2 is 4 million cubic meters, then the percentage contribution of Watershed 1 is 75%. Assuming the same annual water yield (expressed in cubic meters per square kilometer), the larger the watershed, the higher its relative contribution.
The reader must bear in mind that the percentage (colour) is dependent on the size of the watershed. For example, where two neighbouring watersheds have the same water yield per km2, the larger watershed would have a higher proportion of water contribution. For example, during 1971 – 2000, almost 33% of all water flowing out of the Bow River at the confluence with the Oldman River is produced by two small sub-watersheds upstream of Banff, while another approximately 45% is produced in the other Rocky Mountain and adjacent foothill sub-watersheds. The entire lower half of the Bow River watersheds produces only, on average, 3% of the streamflow.