Average Water Footprint by Crop Type
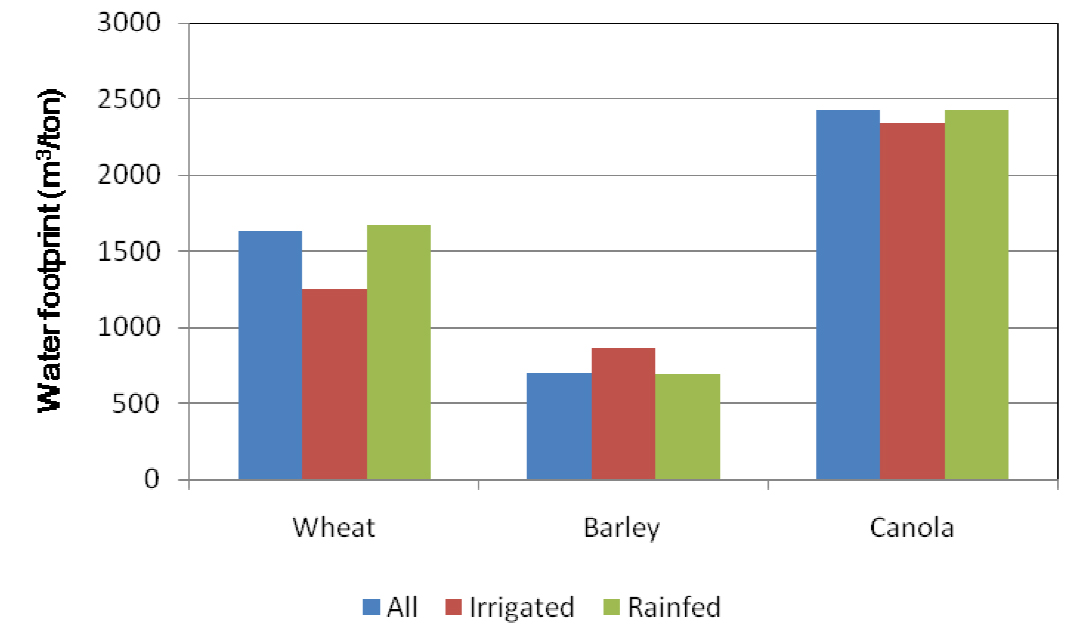
At the provincial level, barley, wheat and canola have a Water Footprint (WF) of 699, 1635 and 2,427 m3/ton respectively (see right chart). The legend for the chart:
- All means the combination of irrigated and rainfed conditions
- Irrigated means irrigated conditions
- Rainfed means rainfed conditions
For both wheat and canola, the WF in the irrigation districts is lower than that outside of the irrigation districts. This means that irrigation is very effective in increasing crop-water productivity of both types of crops.
For barley, it seems the WF is even higher in the irrigation districts. This is probably because the barley is a drought tolerant crop, and barley can often achieve a good yield in dry conditions. Irrigation may not increase crop yield significantly, and as such it is not an effective way to enhance crop-water productivity.
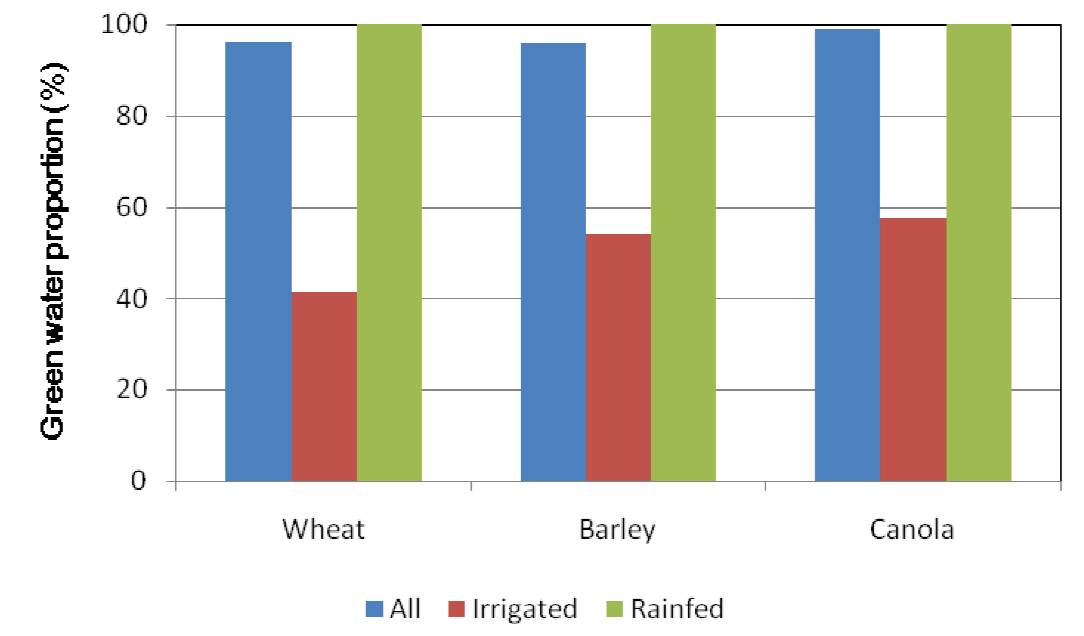
The green water proportions of wheat, barley and canola are all high (96.2% for wheat, 95.9% for barley and 99.1% for canola) at the provincial level (see left chart).
This is mainly caused by the dominant rainfed cropland. When irrigated cropland is considered, wheat, barley and canola have green water proportions of 41.4%, 54.0% and 57.5% respectively. For wheat, almost 60% of the total consumptive water use is from blue water. For barley and canola, the dependency ratio of blue water is lower than 50%.